Stock Market Update
Bias:
Positive for Stocks
Negative for Bonds
- The stock market is making higher-highs and higher-lows, the 50-day moving average is above the 200-day moving average and both those averages are trending higher, and the market hit an all-time high last month. Price is what is most important, and there is no way anyone can be bearish stocks based upon price action.
- The markets ability to continue to advance despite the summer months being historically weak for stocks and ongoing negative headlines (tariffs) is bullish.
- Risk-on assets are outperforming risk-off assets and this is bullish for the broader stock market. For example, stocks are strongly outperforming bonds, high yield bonds are outperforming treasury bonds, and consumer discretionary stocks are outperforming staples.
- The largest drops in the stock market are caused by a recession. An inverted yield curve typically does a good job of forecasting a recession, albeit with a good amount of lead time. As I mentioned in last month’s newsletter, the yield curve has not inverted and thus a recession is probably not imminent.
- Historically October is a weak month for stocks, while November and December are strong.
- Longer-term breadth indicators are displaying negative divergences. These types of negative divergences can last for many months and can get negated by a strong broad-based move up in the market. So on their own, they are not something that would cause us to change our bullish thesis; however, it is something to monitor.
- The weight of the evidence continues to be bullish for the stock market in the near term.
- I believe we are now in a long-term period of rising bond yields. As a result, bonds look to lose value as rates continue to rise. I started talking about this back in October 2017: Bonds – A Ticking Time Bomb and Bonds – A Ticking Time Bomb (Part 2). If you are invested in bonds, now would be a good time to review those holdings.
Client Update
Client accounts continue to be highly invested in various stock mutual funds, individual stocks, and stock exchange-traded funds.
Summary of How I Manage Client Accounts:
- I do not use a buy-and-hold approach like most financial advisors. I believe this strategy, while good for young investors, can have severe adverse consequences for those in or near retirement.
- I use technical analysis to manage risk and preserve principal during major stock/bond market corrections (Bear Markets).
- I have two basic models that I use to manage client accounts. One is conservative and appropriate for investors that are in or near retirement, and an aggressive model for younger more aggressive investors.
- I am a risk manager and will increase our risk level when risk in the market is low, and decrease our risk when risk in the market is high. There have been numerous times in the past where I had clients mainly in money market funds because of high stock market risk.
- I currently view stock market risk to be low and thus I have client accounts invested with a high percentage allocated to stocks.
Market Technicals
It is easy for investors to get confused about the market when you have the media talking about how tariffs are going to create the next bear market or that the Dow Jones Industrial Average falling 100 points is a big deal. Let’s not forget that before there were tariffs and the threat of a trade war, there was:
Brexit
Rising Interest Rates
A Trump Presidential Victory
The End Of QE
North Korea
ETC…
Despite each preceding news item, the stock market has continued to advance. Exogenous events do not control our stock market. Prices rise and fall based upon demand. That demand can be seen in the charts using technical analysis, and that is what matters.
I can’t tell you how many emails I get from people asking about what I am going to do given the ongoing threat of a trade war. There will always be some news item that people will point to as the reason why stocks are going to crash. If we were to have moved out of the stock market simply because of the recent news relating to tariffs, the end of QE, etc., we would have missed the advance in the market that has occurred despite these news items.
Keep in mind, the media’s job is not to educate you, it is to sell advertising. I rarely have the television in my office tuned into any of the various financial news channels. For me, it is just a distraction.
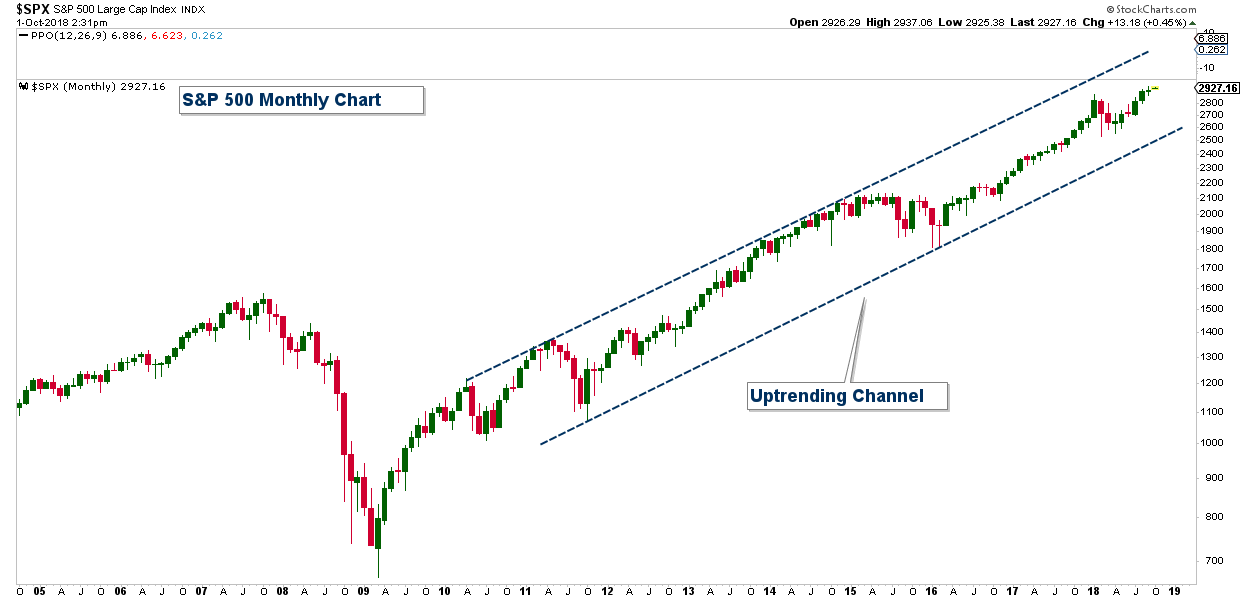
The best way to determine the long-term trend of the market is to zoom out and look at a long-term chart of the market. The S&P 500 (a proxy for the broader stock market) is trending higher and price has been contained within an up-trending channel since the bear market of 2008 ended. As long as price does not fall below the lower trendline, the long-term trend of the market is up.
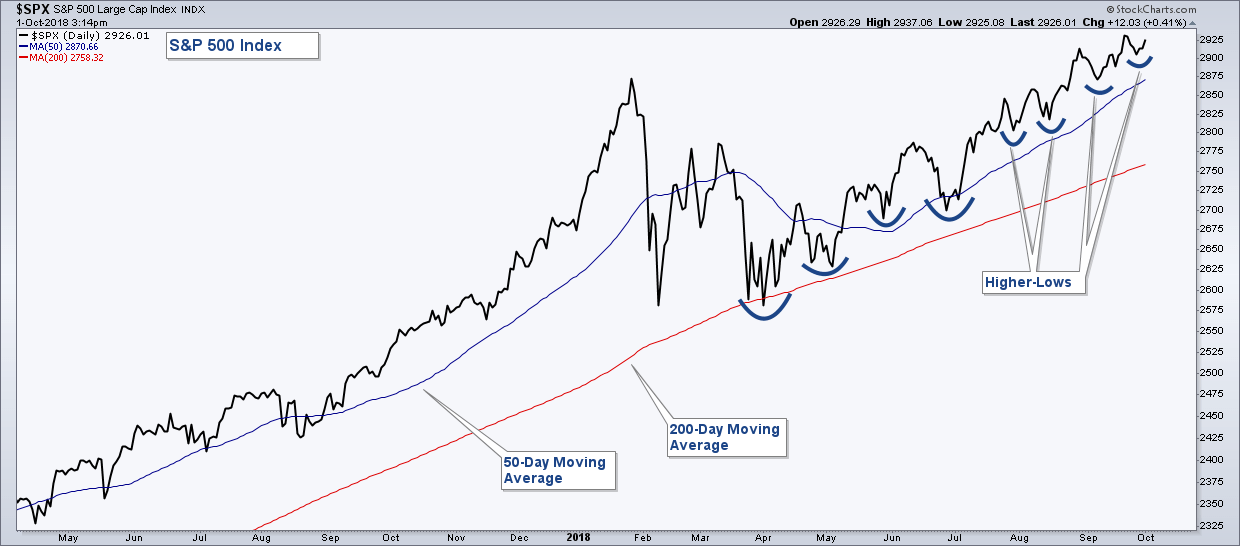
Now let’s zoom in and look at a daily chart. Below is a chart of the S&P 500. The market hit an all-time high recently and the 50-day moving average is above the 200-day moving average, and both those averages are trending higher. In addition, the market continues to form higher-lows and higher-highs. The trend is your friend, and the trend is up.
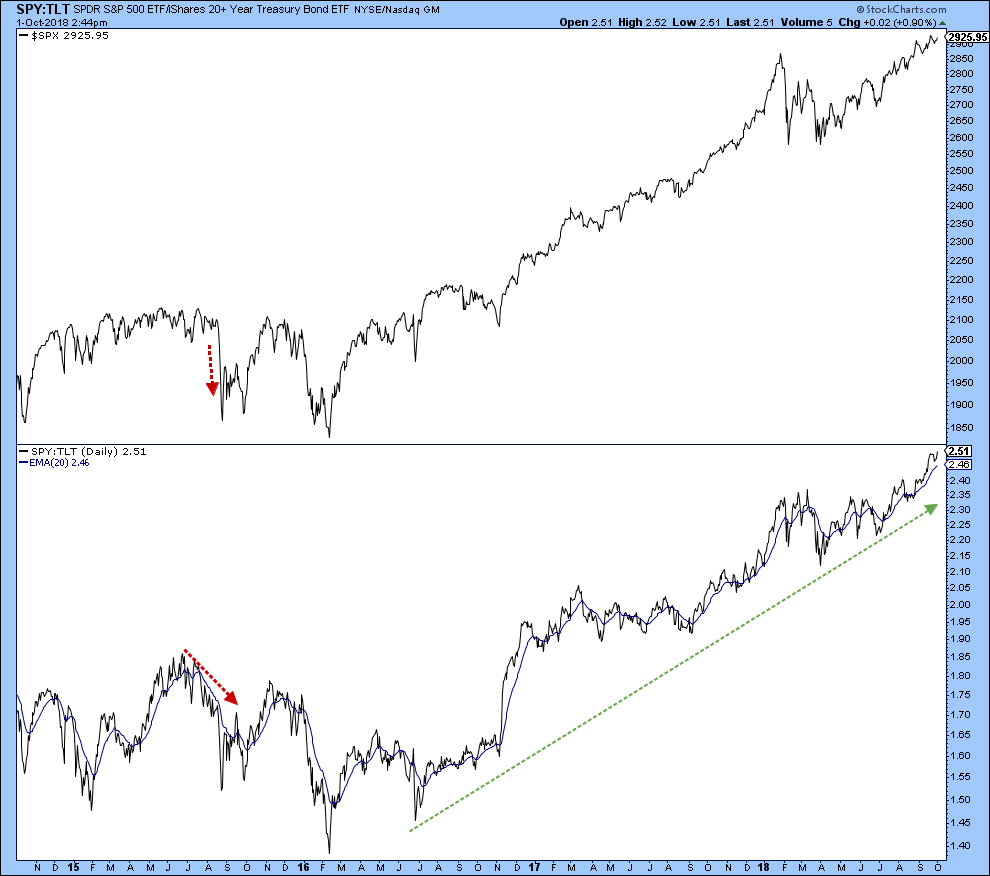
Risk-on assets continue to outperform risk-off assets, and this is bullish for the broader stock market. Below is a chart of the relative performance of SPY (an S&P 500 ETF) versus TLT (a 20+ Year Treasury ETF) in the lower panel, and the S&P 500 in the upper panel. A rising relative strength line indicates that SPY is outperforming TLT.
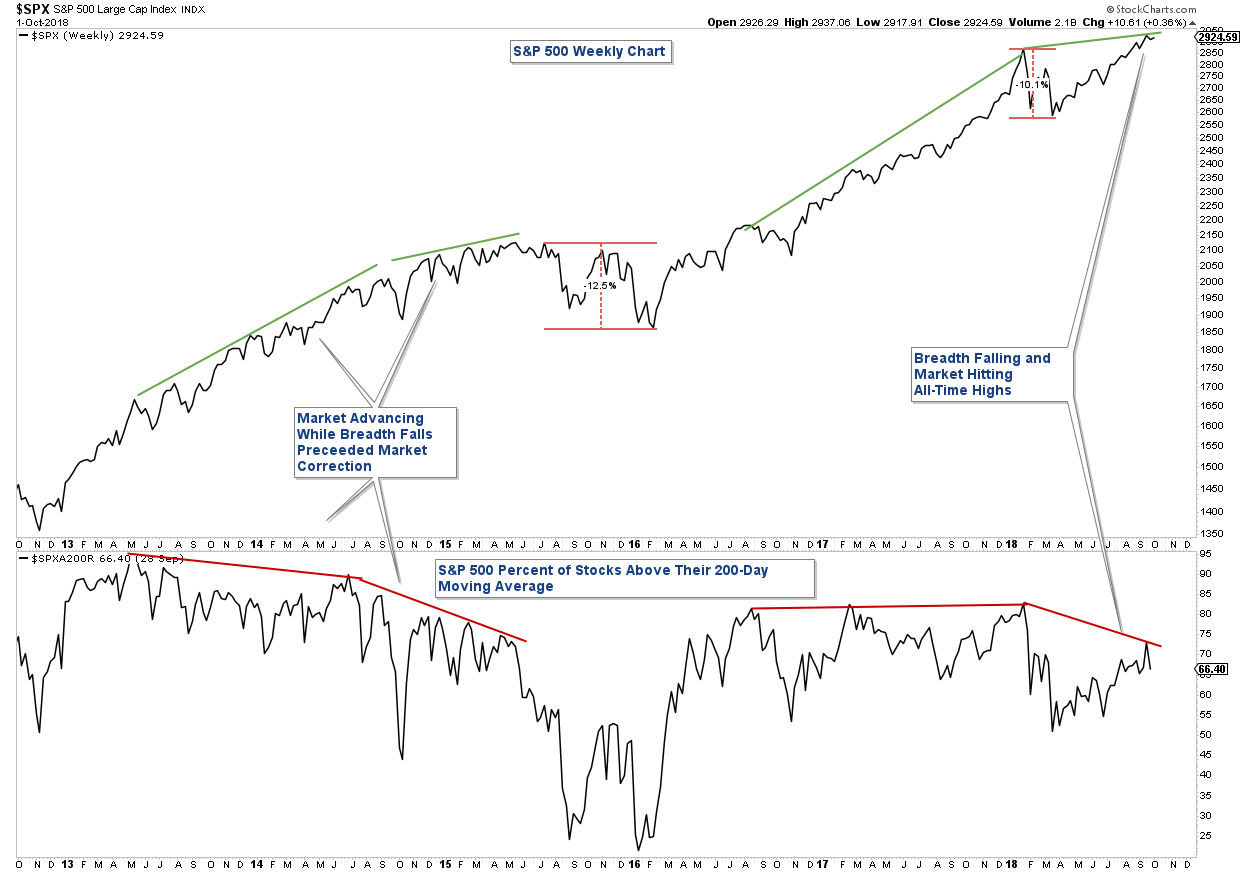
Not all technicals are positive. Below is a chart of the S&P 500 Percent of Stocks Above Their 200-Day Moving Average in the lower panel and the S&P 500 in the upper panel. There is currently a negative divergence between the breadth indicator and the market. The S&P 500 is rising and hitting new all-time highs, while the percent of stocks above their 200-day moving average is falling. This chart is suggesting that long-term market breadth is not confirming recent market highs.
I am not too worried about this particular chart yet, for a few different reasons:
- As mentioned above, these types of negative divergences can last for many months and can get negated by a strong broad-based move up in the market.
- There are numerous other breadth indicators that are bullish.
- The majority of the evidence still is bullish.
This is a chart that I will continue to monitor. If this chart continues to diverge negatively from price, AND other technical indicators begin to show weakness, then it would be appropriate to reevaluate our bullish thesis. Until then, the weight of the evidence continues to be bullish for stocks.
 In summary, price action is bullish, market breadth is mostly positive, risk-on assets are leading the market higher, and thus the weight of the evidence continues to be bullish for the stock market.
If you have any questions or would like me to review your portfolio, please feel free to contact me.

Craig Thompson, ChFC
Email: [email protected]
Phone: 619-709-0066
Asset Solutions Advisory Services, Inc. is a Fee-Only Registered Investment Advisor specializing in helping the needs of retirees, those nearing retirement, and other investors with similar investment goals.
We are an “active” money manager that looks to generate steady long-term returns, while protecting clients from large losses during major market corrections.
Asset Solutions is a registered investment adviser. Information presented is for educational purposes only and does not intend to make an offer or solicitation for the sale or purchase of any specific securities, investments, or investment strategies. Investments involve risk and unless otherwise stated, are not guaranteed. Be sure to first consult with a qualified financial adviser and/or tax professional before implementing any strategy discussed herein. Past performance is not indicative of future performance.