Stock Market Update
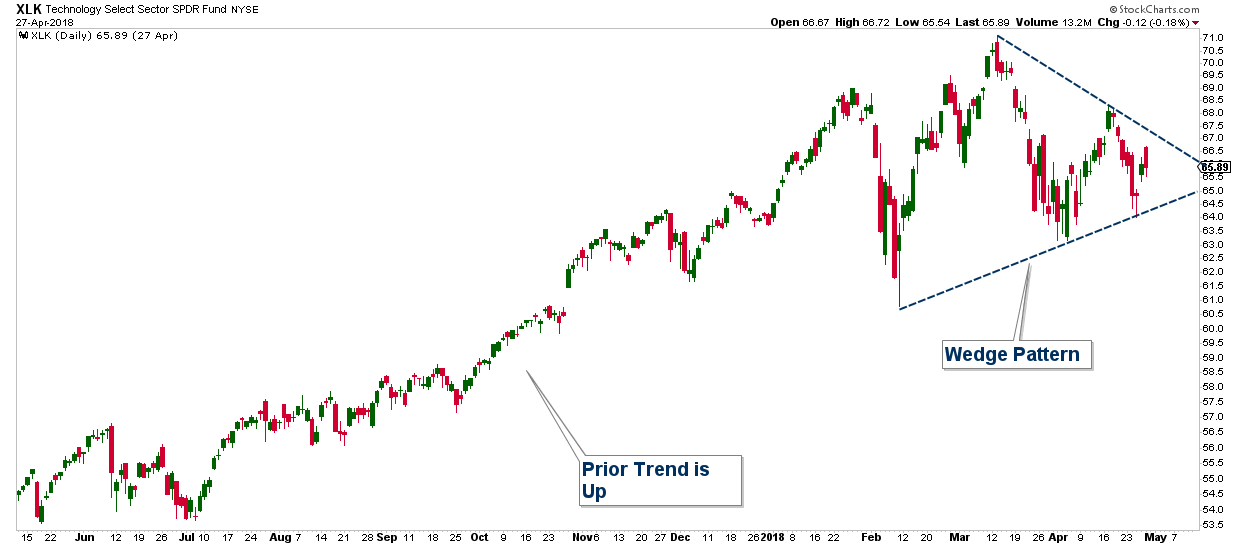
Bottom line, the stock market is in a long-term uptrend; however, over the past 3 months, it has been stuck in a consolidation pattern. I am seeing a pennant pattern (which is a type of consolidation pattern) in many broad indexes and individual stocks. For example, below is a chart of XLK (a technology ETF). As you can see, if you draw a trendline at the tops and bottoms, it forms a pennant pattern. This pattern historically resolves in the direction of the prior trend, which in this case is up.
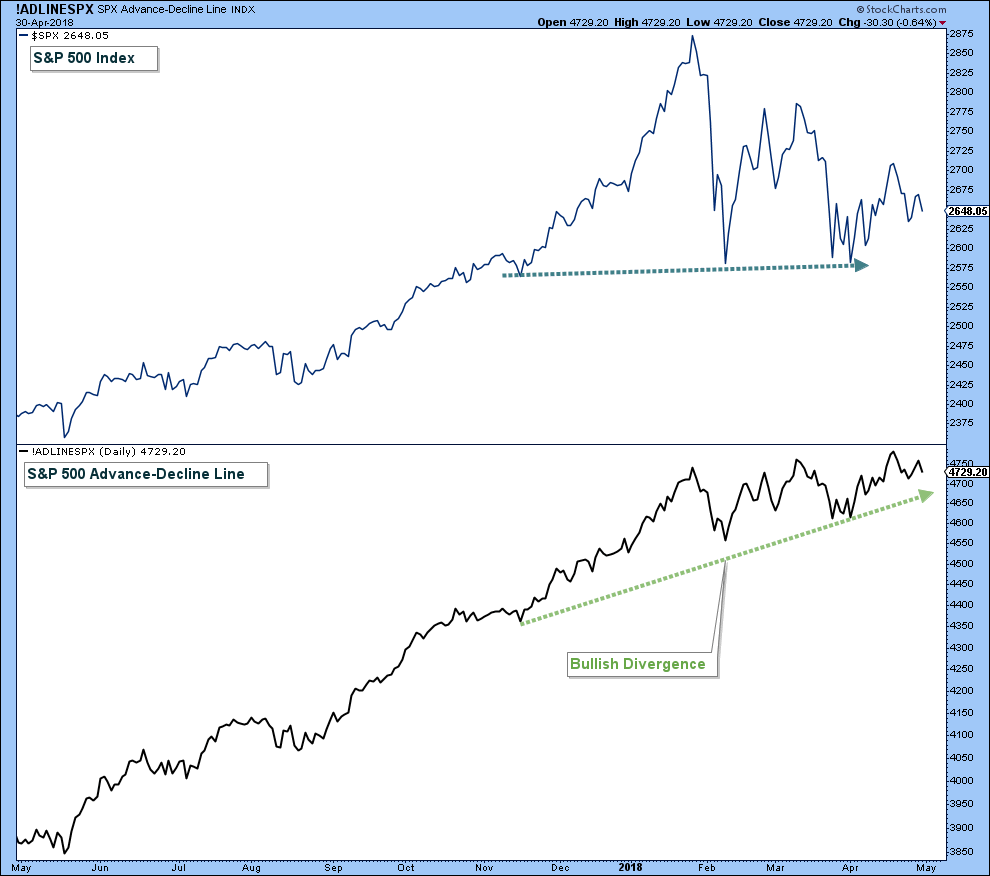
It is hard to be Bearish when I see positive divergences in the Advance-Decline Line.
While the weight of the evidence strongly suggests that the stock market will resolve this consolidation to the upside, we have to continue to monitor technicals for signs that something changes or that we are simply wrong in our analysis.
One thing that I am monitoring is market breadth. For the stock market to gain any lasting traction to the upside, we need to see strong institutional buying. Thus technically, what we need to see is a strong move up in the stock market, combined with a very high level of upside participation from the universe of stocks. When it occurs, it will be apparent in certain market breadth charts, like the one below.
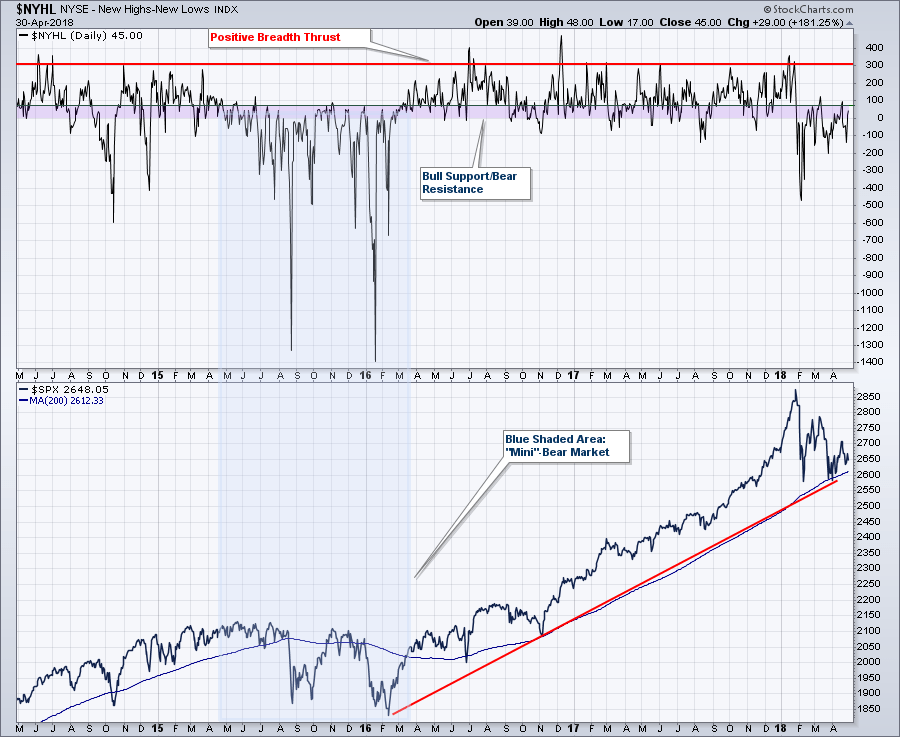
In the upper panel is a breadth chart that calculates the number of stocks hitting new highs versus new lows. This indicator simply subtracts the number of stocks hitting new 52-week lows from those stocks hitting new 52-week highs. When there are more new highs the indicator is positive, which favors the bulls and when it is negative there are more new lows and this favors the bears.
Here are things to notice in the chart below:
First, I put a horizontal red line at 300. This is an area that when hit, I view it as a positive breadth thrust. This type of positive market participation routinely occurs during bull markets.
Second, the horizontal purple area has acted as an area where bear markets tend to top out. Notice how when we were in the market decline of 2015-2016 (mini-bear market notated in light blue), this indicator would top out when it hit this area and the stock market (lower panel) would soon decline.
In summary, if the stock market is still in a bull market then I would expect to see a strong move up in the stock market accompanied by high individual stock participation in the near future. On the other hand, if we see the opposite; a strong down move in the stock market and market breadth not able to advance much above the purple area, then that would be a very bearish development. One that would require me to reevaluate our bullish bias. Of course, given that the majority of my analysis indicates market strength, I would view the former to be the higher odds outcome.
The stock market has now been consolidating for three months. There is no way to know with absolute certainty which direction this consolidation will resolve itself; however, the weight of the evidence continues to suggest higher prices over the intermediate term.
If you have any questions, please feel free to shoot me an email.
The Bottom Line
Bias:
Positive for Stocks and Commodity Prices
Negative for Interest Rate Sensitive Bonds
• Short-term, the stock market has been correcting within a longer-term uptrend. As long as the S&P 500 does not fall below the February/April lows, the long-term trend is still up.
• Long-term, the weight of the evidence continues to be bullish for stocks. At some point, this will change and when it does, I will have no problem flipping to a bearish bias and reallocating client accounts to a more defensive posture. However, market technicals continue to signal that we are in a bull market and thus we should be invested in stocks aggressively.
• Bond prices have been falling as bond yields have transitioned out of a 37 year period of decline. This trend of falling bond prices will adversely affect retirees for years to come. If you are interested in receiving my E-book (Bonds – A Ticking Time Bomb) on this topic, shoot me an email and I will send it to you for free.
Client Update
I continue to view stock market risk as low, thus our accounts have high stock market exposure.
We do not hold any interest rate sensitive bond funds.

Craig Thompson, ChFC
Email: [email protected]
Phone: 619-709-0066
Asset Solutions Advisory Services, Inc. is a Fee-Only Registered Investment Advisor specializing in helping the needs of retirees, those nearing retirement, and other investors with similar investment goals.
We are an “active” money manager that looks to generate steady long-term returns, while protecting clients from large losses during major market corrections.
Asset Solutions is a registered investment adviser. Information presented is for educational purposes only and does not intend to make an offer or solicitation for the sale or purchase of any specific securities, investments, or investment strategies. Investments involve risk and unless otherwise stated, are not guaranteed. Be sure to first consult with a qualified financial adviser and/or tax professional before implementing any strategy discussed herein. Past performance is not indicative of future performance.