Stock Market Update
Market Update
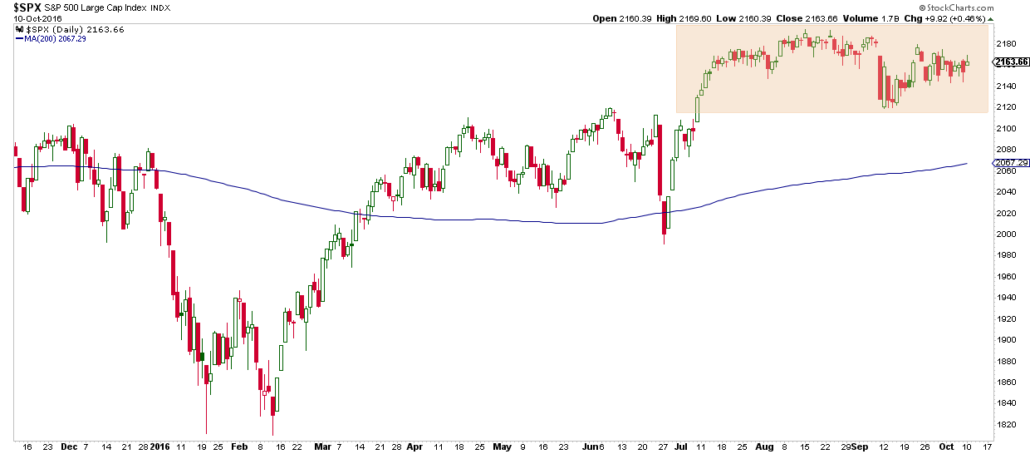
We are now three months into a stock market consolidation, as can be seen in the chart below of the S&P 500. In our July 18, 2016 newsletter I stated that:
“Many indicators are suggesting this stock market advance is likely to continue. However, near term, the current extreme in investor complacency/fearlessness that emerged last week plus July seasonality warn that the sharp rally off the Brexit lows is unlikely to continue much further, if at all, without at least a minor pullback first – which I believe will occur between now and month end.”
Nothing has changed since then and my view continues to be that in the near-term we are at a somewhat elevated risk of either more consolidation or a short-term pullback in stocks. However, longer-term market internals are suggesting that odds favor higher stock prices.
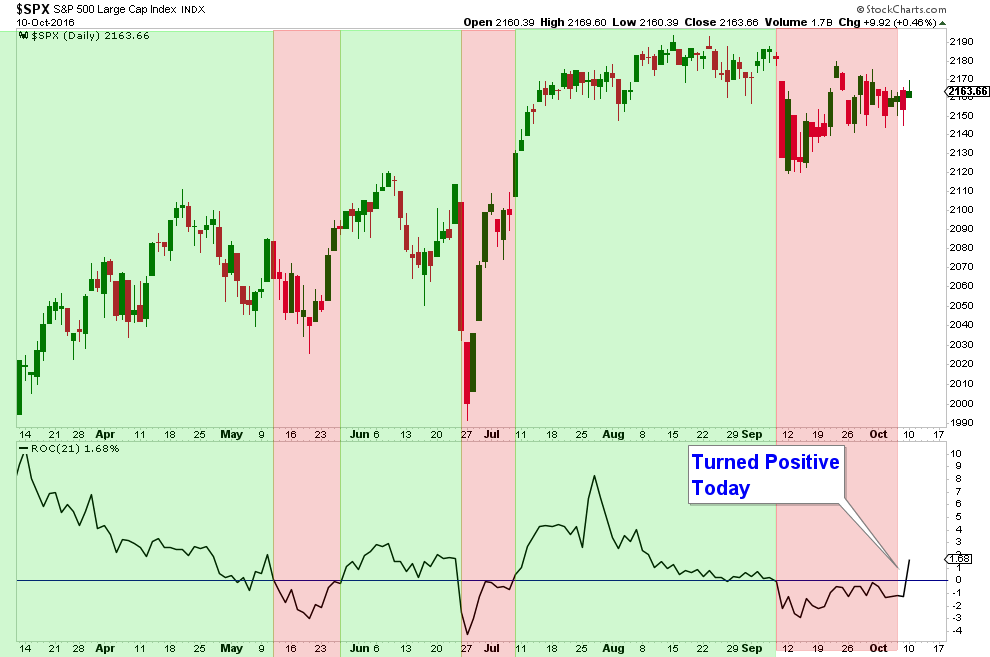
One positive development today is that many market momentum indicators have turned positive. Below is a chart of the 21-Day Rate-Of-Change Indicator and it turned positive today.
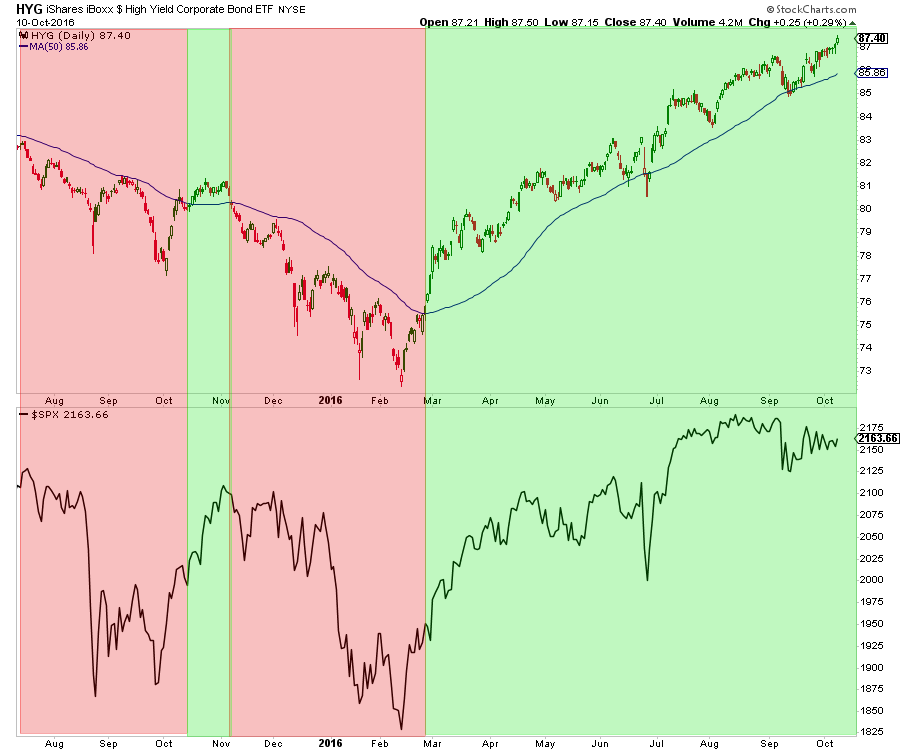
One reason I feel that longer-term stock market internals are favorable is how some of the more aggressive sectors are currently performing. Below is a chart of a High Yield ETF (HYG) and when its price is above its 50-day moving average, that is a sign we are in a positive stock market environment.
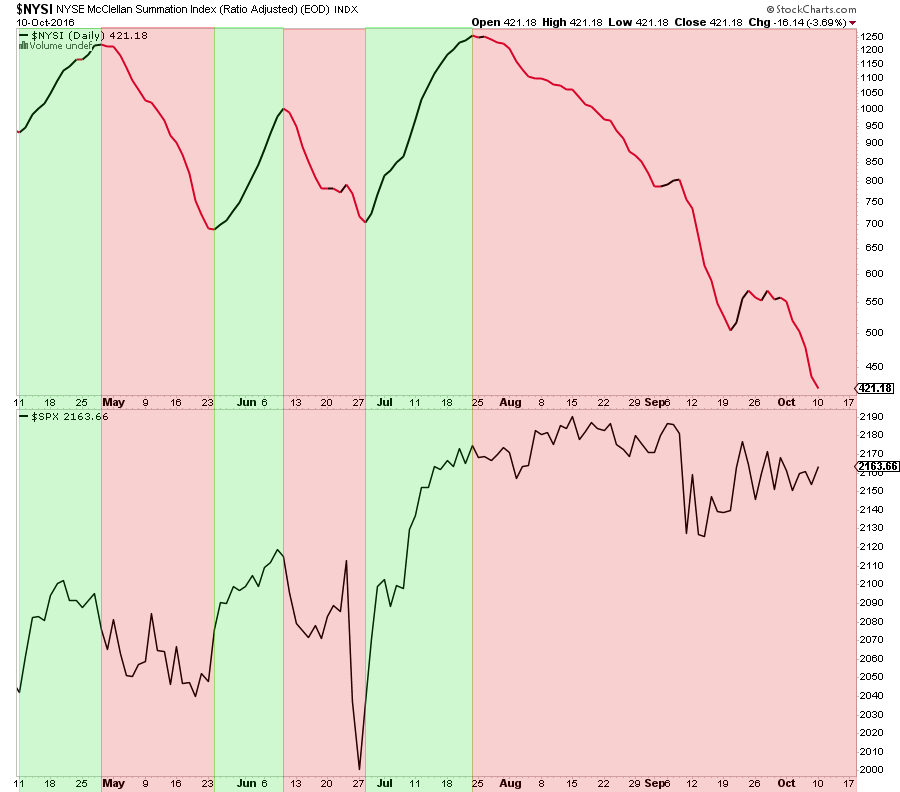
Market Breadth Indicators are still negative. Any time that the Summation Index is trending down (chart below), it is a warning sign that near-term stock market risk is elevated.
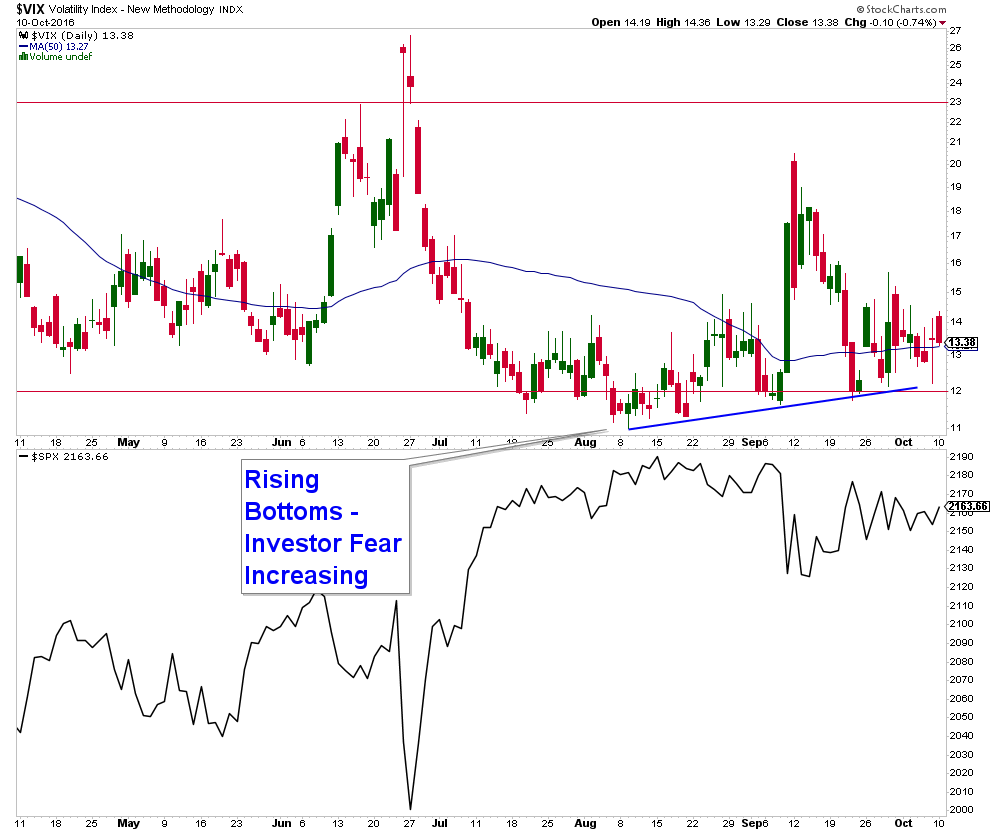
History continues to warn that the US stock market’s near term upside from here is limited at best due to historically low volatility according to the VIX (chart shown in last week’s newsletter).
Also, over the past couple of months the bottoms made by the VIX are slowly creeping up as can be seen in the pattern of rising bottoms (chart below). This is a warning sign that we could see a substantial rise in volatility in the near future, which would coincide with a drop in the stock market.
While it is a positive sign that momentum indicators have turned positive, negative market breadth and elevated levels of investor complacency as measured by the VIX are warning signs that near-term market risk is still elevated.
The Bottom Line
Short-term stock market risk is currently high. Until Market Breadth Indicators turn positive, odds are elevated that stocks will fall or continue to churn sideways over the near-term.
Bias: Neutral (Short-term negative, long-term positive for stocks.)
- Long-term stock market price action is positive and will remain so as long as prices remain above the June 2016 lows.
- Market internals suggest a positive environment for stocks over the longer-term.
- The short-term market weakness that was signaled by market internals as far back as mid-July has been confirmed. The market is now in the process of correcting/consolidating. Short-term market risk is high.
Client Update
Client accounts are between 55% to 75% invested in lower volatility funds. I sold a couple of our funds last week because their performance had leveled off.
I will be looking to add funds that I have identified as providing attractive risk-adjusted return characteristics once short-term internals turn positive.
For the most part, our accounts have trended up with very minor volatility this year.
15 Surprising Places You Never Considered For Retirement


Craig Thompson, ChFC
Email: [email protected]
Phone: 619-709-0066
About Asset Solutions
Asset Solutions Advisory Services, Inc. is a Fee-Only Registered Investment Advisor specializing in helping the needs of retirees, those nearing retirement, and other investors with similar investment goals.
We are an “active” money manager that looks to generate steady long-term returns, while protecting clients from large losses during major market corrections.