When I published last month’s newsletter the stock market was pulling back prior to the election. The S&P 500 fell about 7.5% peak-to-trough in October. In that update, I wrote that the weight of the technical evidence was suggesting that October’s weakness was likely temporary and odds favored higher prices no matter who won the election. Those technical signals ended up being accurate and now most major broad market indexes have advanced to new all-time highs.
Now that major market indexes are sitting at all-time highs, is the market still bullish?
In a strong bullish market, you historically see a risk-on environment, positive market breadth, sector rotation, and declining volatility. This is exactly what I continue to see in market technicals and as a result, I view market conditions to be favorable for stocks in the near and intermediate-term.
Below is a chart of the S&P 500. Notice how the index formed a bullish wedge continuation pattern after a strong advance in July and August. The early November bounce off the lower end of the wedge propelled the index above the top of the wedge to new all-time highs. This is bullish price action.

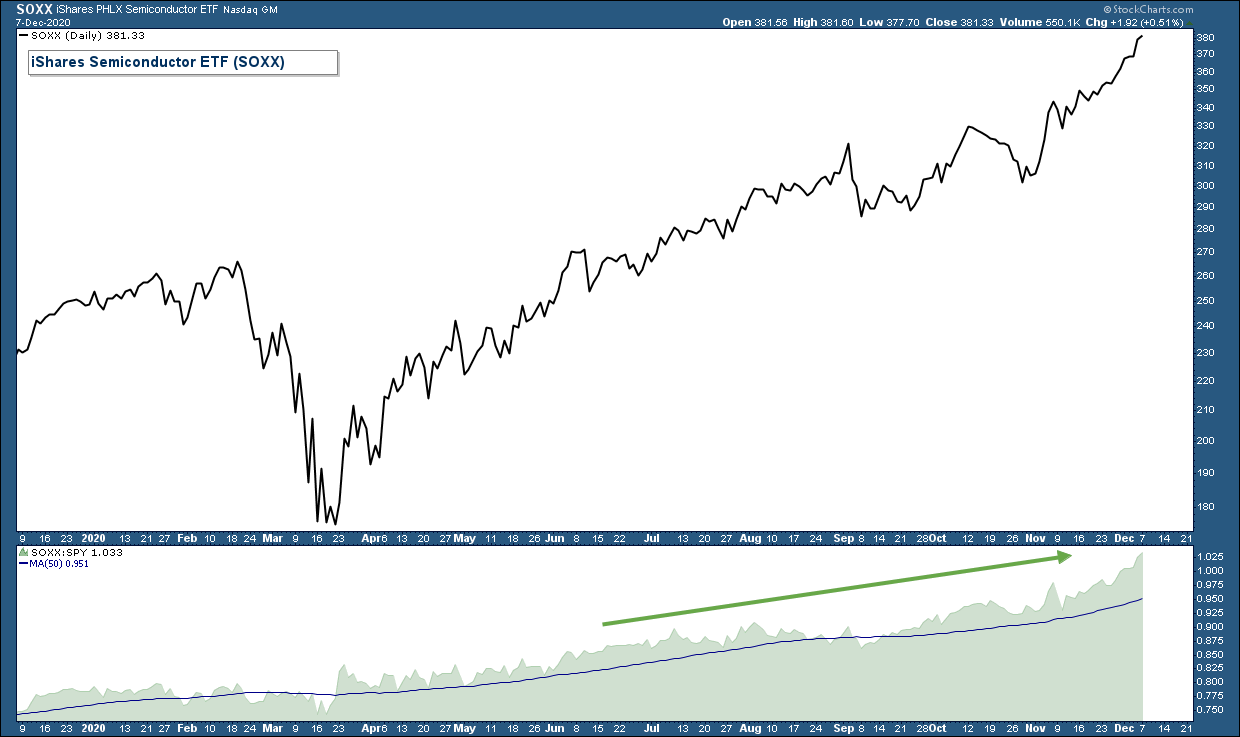
To confirm a bullish market environment you want to see risk-on stocks advancing, or better yet, outperforming the broader stock market indexes.
Below is a chart of the Semiconductor industry group ETF (SOXX) in the top panel, which is a risk-on index. In the lower panel is a relative strength chart which rises when SOXX is outperforming SPY (S&P 500 ETF). Notice how the index is advancing strongly and continues to outperform the S&P 500.
The most popular risk-off asset is US Treasuries and during times of high market stress, you typically see money move out of stocks into the safety of Treasuries.
In the chart below is a Treasury Bond ETF (TLT) in the upper panel, the S&P 500 in the middle, and a relative strength chart of TLT versus SPY (an S&P 500 ETF) in the bottom panel.
On the far left side of the chart, notice how TLT was advancing strongly prior to the 33% decline in the S&P 500. In the bottom panel, the green shaded area moved higher reflecting the out-performance of Treasuries relative to the S&P 500. This was a technical clue that market conditions were deteriorating even though the S&P 500 was trending higher.
Now look at the right side of the chart and you see the opposite dynamic. Treasuries have been declining since August and have underperformed the S&P 500 on a relative basis since the market bottom in March.

Sector rotation is a healthy way for the market to advance over long periods of time. As one sector/industry group gets overextended, money will move out that group into another group that may not be as overbought.
We have seen this dynamic recently. Money has moved out of big-cap technology stocks into Banking, Energy, and Small-Cap stocks.
Below is a chart of IWM (a Small-Cap Index ETF) in the upper panel and it’s relative strength versus the S&P 500 in the lower panel. Small-Caps have advanced strongly recently, hitting an all-time high, and have been outperforming the S&P 500 since the beginning of October.

There are numerous broad stock market breadth charts that are displaying strength. Below is one of my favorites.
In the top panel is the NASDAQ Composite Index and in the lower panel is the ratio of Nasdaq stocks hitting new 52-week highs divided by the number of Nasdaq stocks declining. Because this ratio is volatile I have charted the 34-day moving average of this ratio (pink line).
If the number of stocks hitting new highs is greater than the number of stocks declining on average, this line will rise. Notice how this breadth indicator declined prior to the February market peak, signaling that from a breadth perspective, market conditions were weakening despite the market continuing to advance.
Now, look at how it is advancing strongly since the beginning of November. The market is rising and market breadth continues to display strength.

The Bottom Line
The stock market is in an uptrend.
The weight of the technical evidence strongly suggests that market conditions remain positive.
Client Account Update
Client accounts are fully invested.
As always, managing risk is paramount, and protecting our clients from major losses during severe market corrections is our focus.
If you have any questions, please feel free to send me an email.

Craig Thompson, ChFC
Email: [email protected]
Phone: 619-709-0066
Asset Solutions Advisory Services, Inc. is a Fee-Only Registered Investment Advisor specializing in helping the needs of retirees, those nearing retirement, and other investors with similar investment goals.
We are an “active” money manager that looks to generate steady long-term returns, while protecting clients from large losses during major market corrections.
Asset Solutions may discuss and display, charts, graphs, formulas which are not intended to be used by themselves to determine which securities to buy or sell, or when to buy or sell them. Such charts and graphs offer limited information and should not be used on their own to make investment decisions. Most data and charts are provided by www.stockcharts.com.
Asset Solutions is a registered investment adviser. Information presented is for educational purposes only and does not intend to make an offer or solicitation for the sale or purchase of any specific securities, investments, or investment strategies. Investments involve risk and unless otherwise stated, are not guaranteed. Be sure to first consult with a qualified financial adviser and/or tax professional before implementing any strategy discussed herein. Past performance is not indicative of future performance.
All charts provided by: StockCharts.com