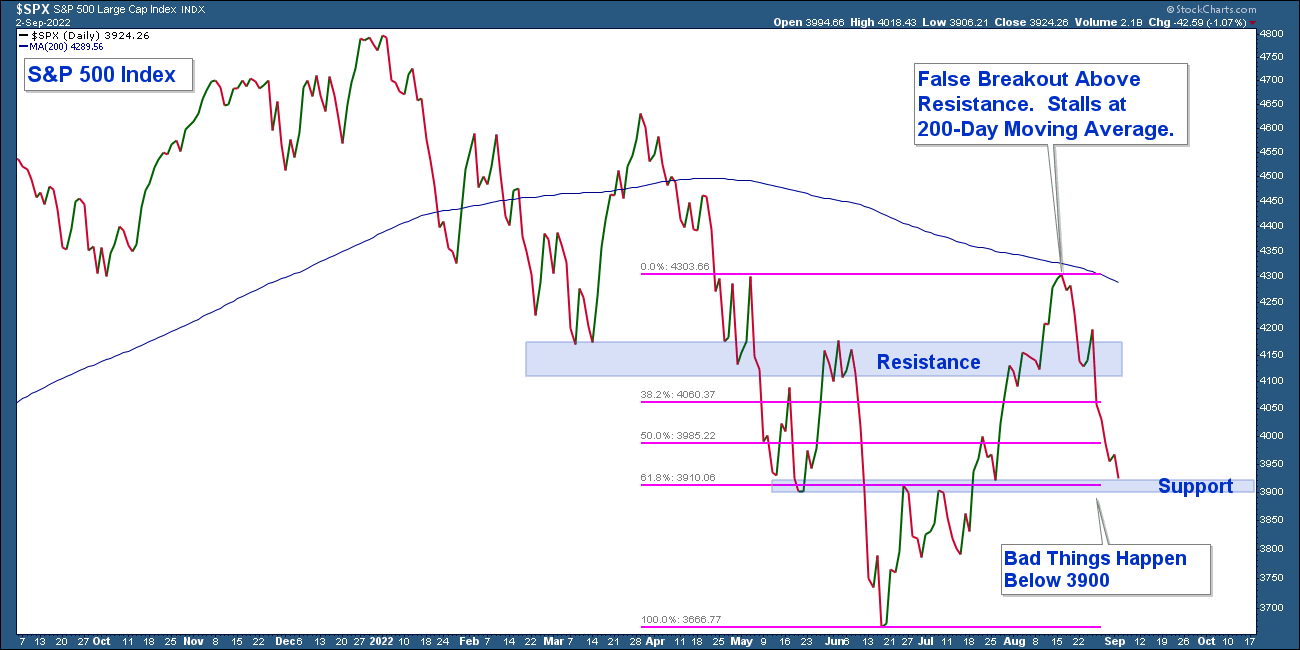
Below is a daily chart of the S&P 500 index. Here are the major takeaways:
- The index is below its 200-day moving average and that average is falling. This is characteristic of a bearish longer-term market environment.
- After advancing above resistance, the index reversed course right below the 200-day moving average. This failed breakout is short-term bearish and investors that bought the advance quickly got whipsawed.
- The index is sitting at support which coincides with the 61% Fibonacci Retracement level.
For the bulls to have a chance they need the S&P 500 not to fall decisively below support at 3900. If support is violated a retest of the June lows is likely. I feel the odds of support holding are low.
Market technicians use candlestick charts, as opposed to line charts, because they provide substantially more data about price patterns than other types of charts. Often times a single candle can have bearish or bullish characteristics.
At the beginning of each month, I review monthly charts to get a longer-term perspective of markets. Then I compare that analysis to what is occurring in shorter-term charts.
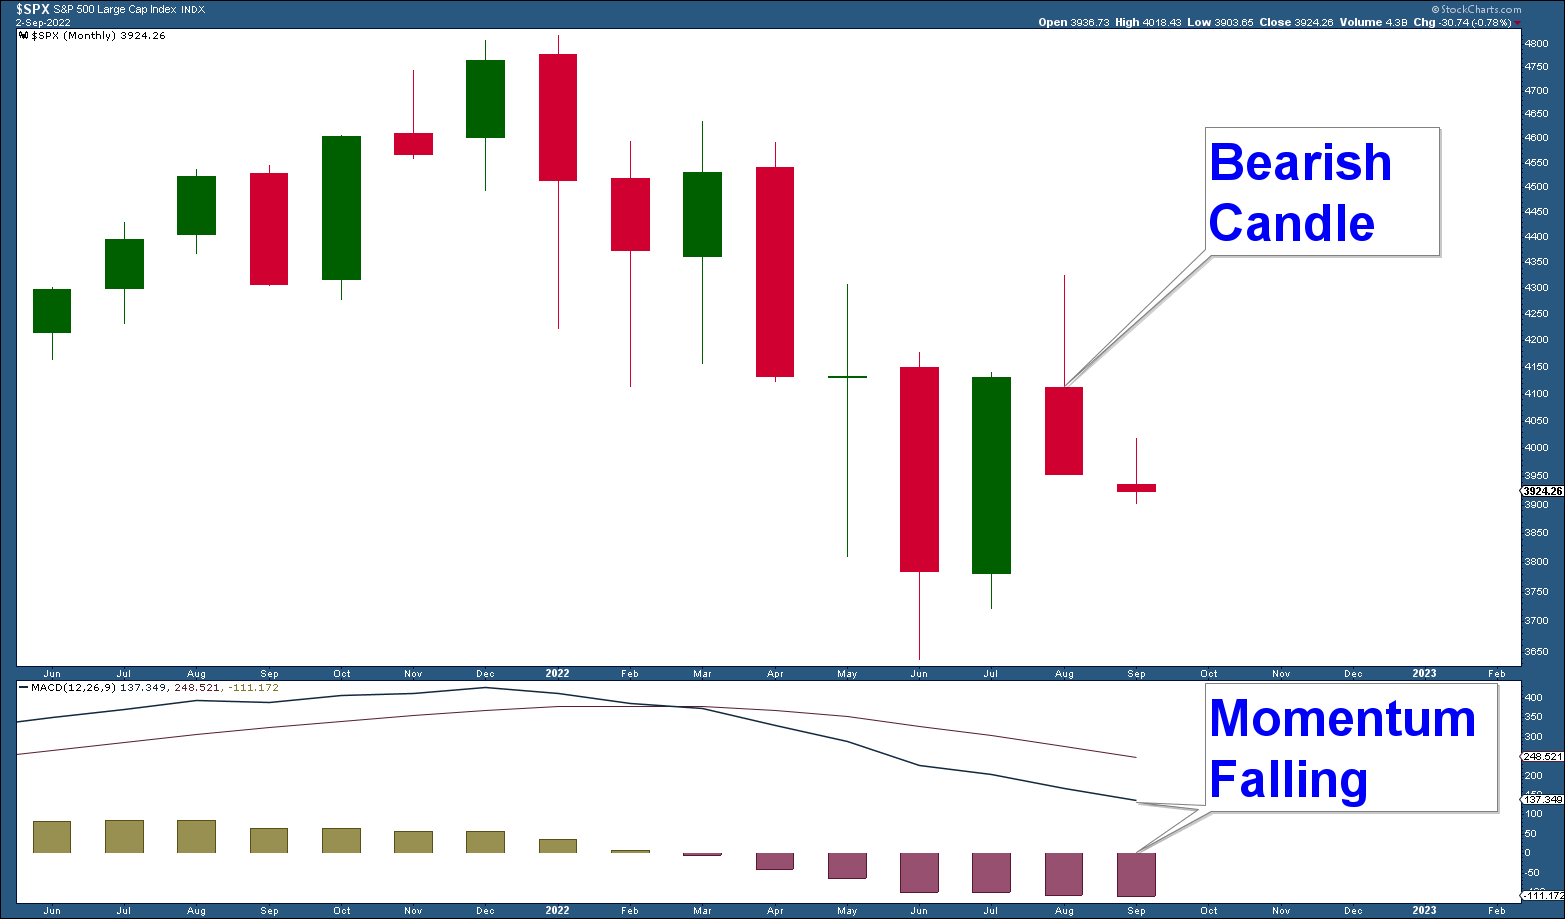
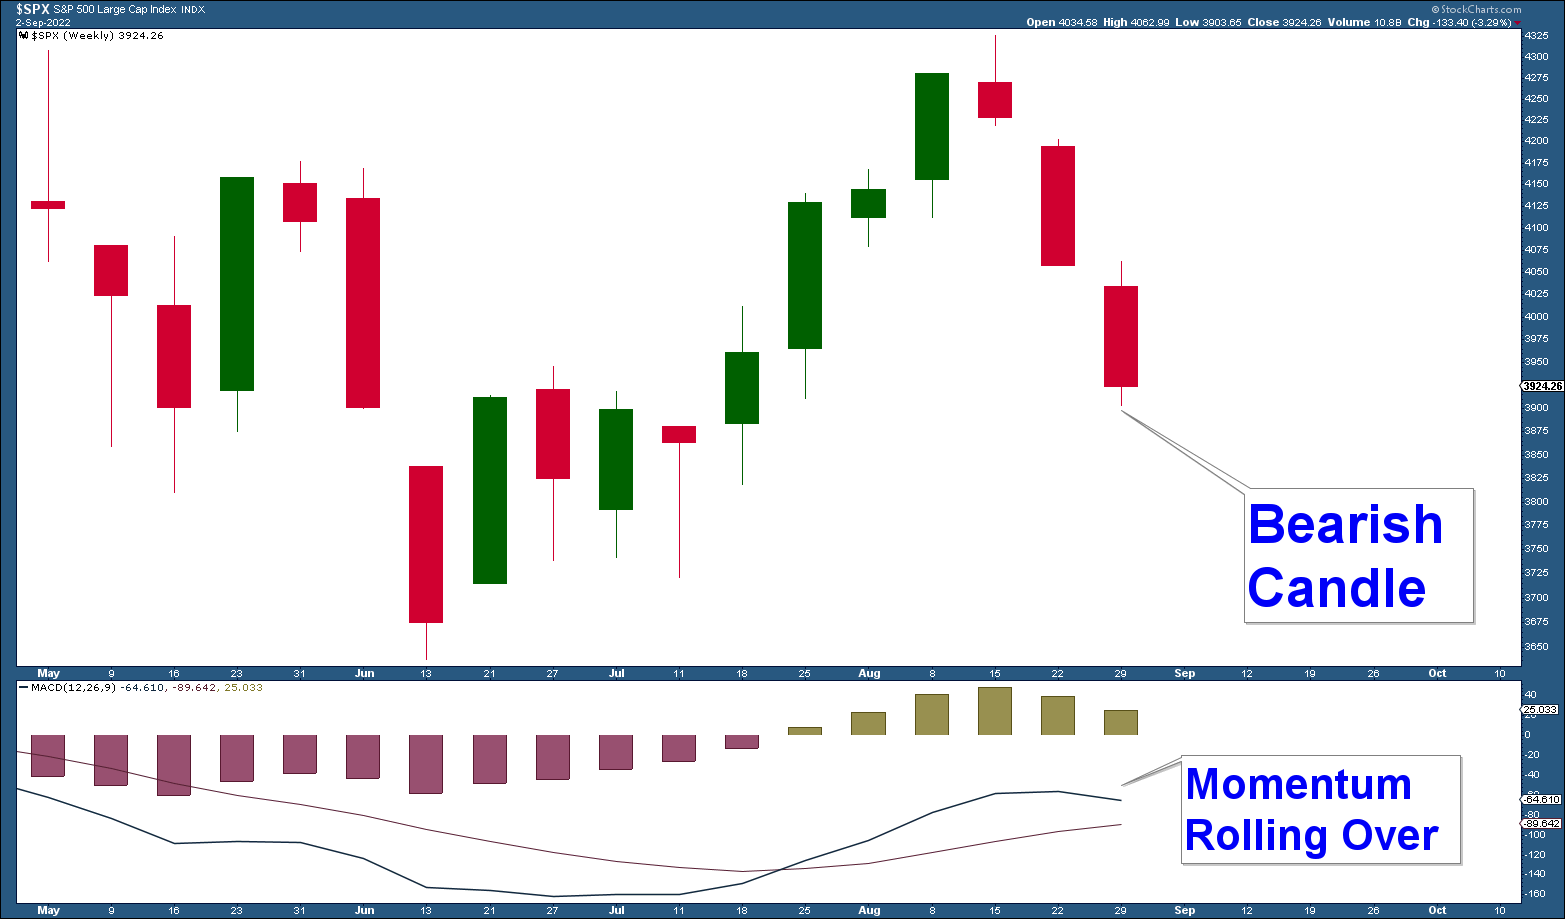
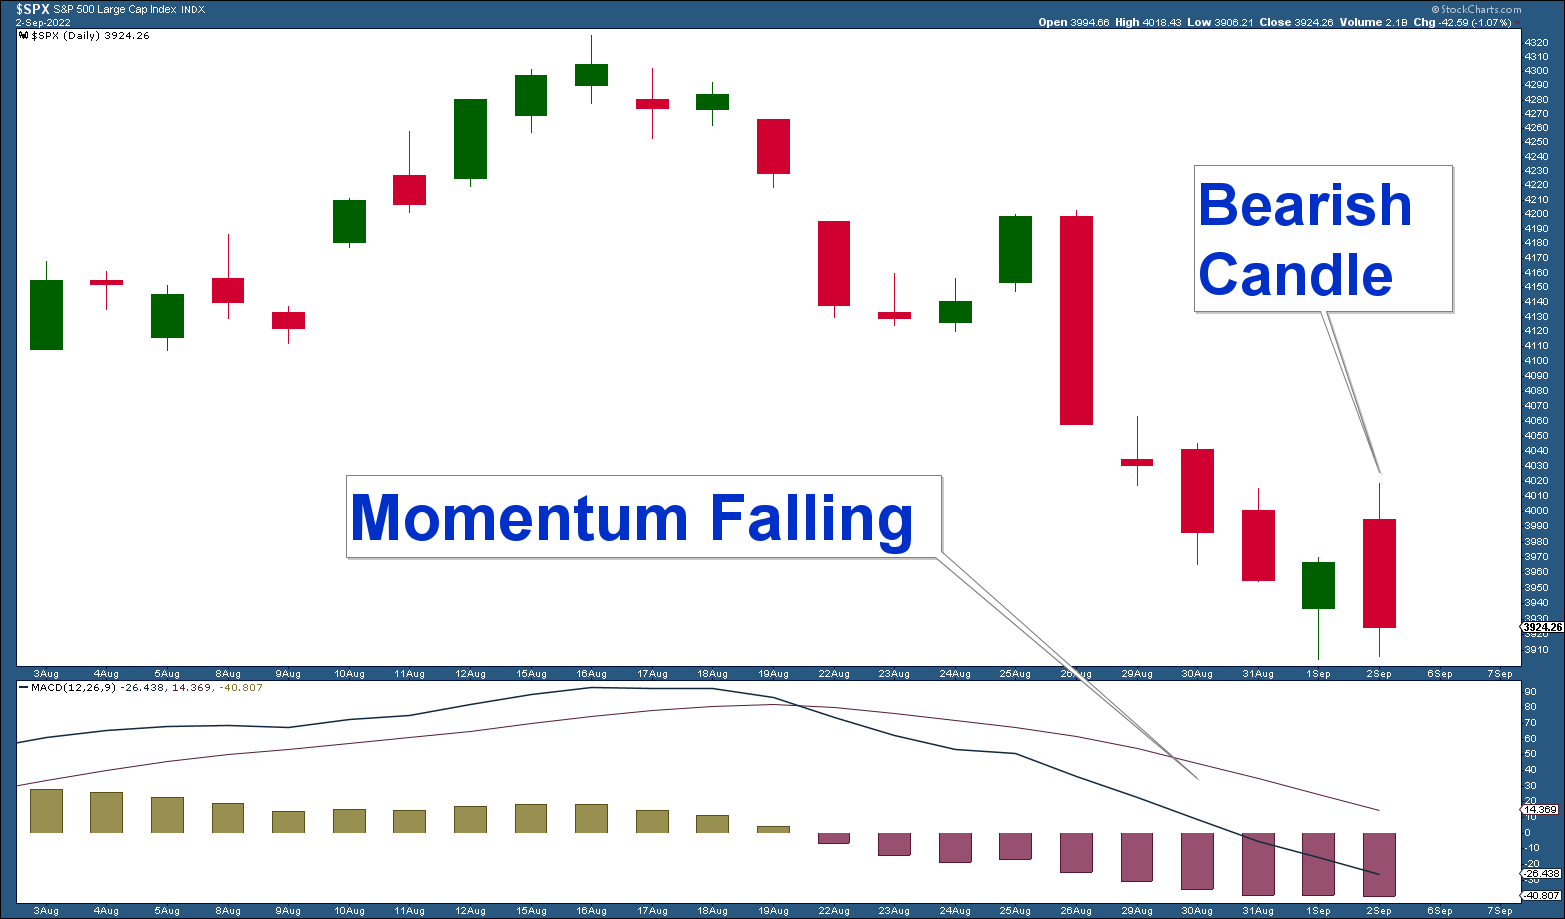
Below is a monthly, weekly, and daily candlestick chart of the S&P 500 Index. With these charts, I analyze the most recent candle and momentum for the various time horizons.
All three of the most recent candles are bearish and momentum is falling in both the monthly and daily charts. Momentum in the weekly chart is still up; however, it looks like it is in the process of potentially rolling over.
In summary, momentum is bearish on both a long-term and short-term basis. And the most recent candle in each time frame is bearish suggesting odds are elevated that we could see more downside pressure in stocks.
S&P 500 Monthly Chart
Candle – Bearish
Momentum – Falling
S&P 500 Weekly Chart
Candle – Bearish
Momentum – Rolling Over
S&P 500 Daily Chart
Candle – Bearish
Momentum – Falling
In our June 16, 2022, Capitulation Common at Market Bottoms Market Update, I highlighted that major bear market corrections commonly end with a strong move down where there is massive selling as investors run for the exits in mass. And of course, once you deplete your pool of sellers you are left with an imbalance of buyers that easily move the market higher.
This capitulation in selling pressure is commonly charted using the Volatility Index (VIX) which is a sentiment indicator. The VIX projects market volatility and thus fear given market volatility typically increases during market corrections.
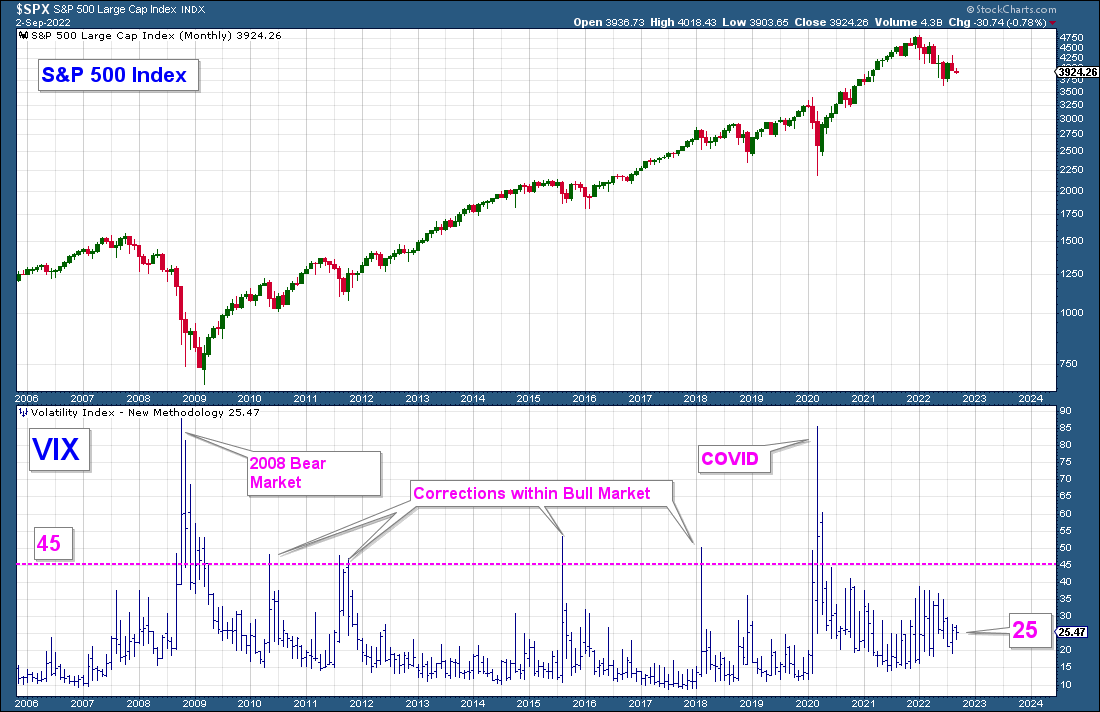
In the chart below I have the S&P 500 index in the top panel and the VIX in the lower panel. Here are my takeaways from the chart:
Past garden variety corrections that occurred during the 2009 to 2022 secular bull market saw the VIX top out at about the 45 level (pink horizontal line) and the two major corrections that occurred during recessions (2008 and 2020) saw the VIX top out above 85. Each of these highs marked the ultimate low in their respective corrections.
Now, look at how the VIX has behaved this year. It is at 25 and has not come near 45. The fall in the stock market this year has been comparatively orderly and without any major fear.
If the June lows are decisively violated, I think odds are good that you will see the VIX rise strongly and thus this indicator could be valuable in forecasting the next tradeable bottom in the market.
If you are the typical conservative investor using a buy-and-hold strategy you are more at risk today than you have been any time over the past 40 years. No longer are we in an environment of falling yields that provide a major tailwind to stock and bond prices. We are now in an inflationary environment that could last for a long time and the Fed’s ability to fight it is limited given the amount of debt we have accrued as a nation.
When US debt-to-GDP is well over 100% your ability to service that debt is dependent on rates staying low. Yet the Fed has to raise rates and reduce its balance sheet to control inflation but in doing so it puts the US at risk of theoretical default. And there lies one reason that many investors were expecting a Fed pivot. Of course, those hopes were dashed with the Fed’s recent Jackson Hole speech. I don’t want to go too far down this rabbit hole, but both stock and bond markets are in uncharted territory, and risk is elevated.
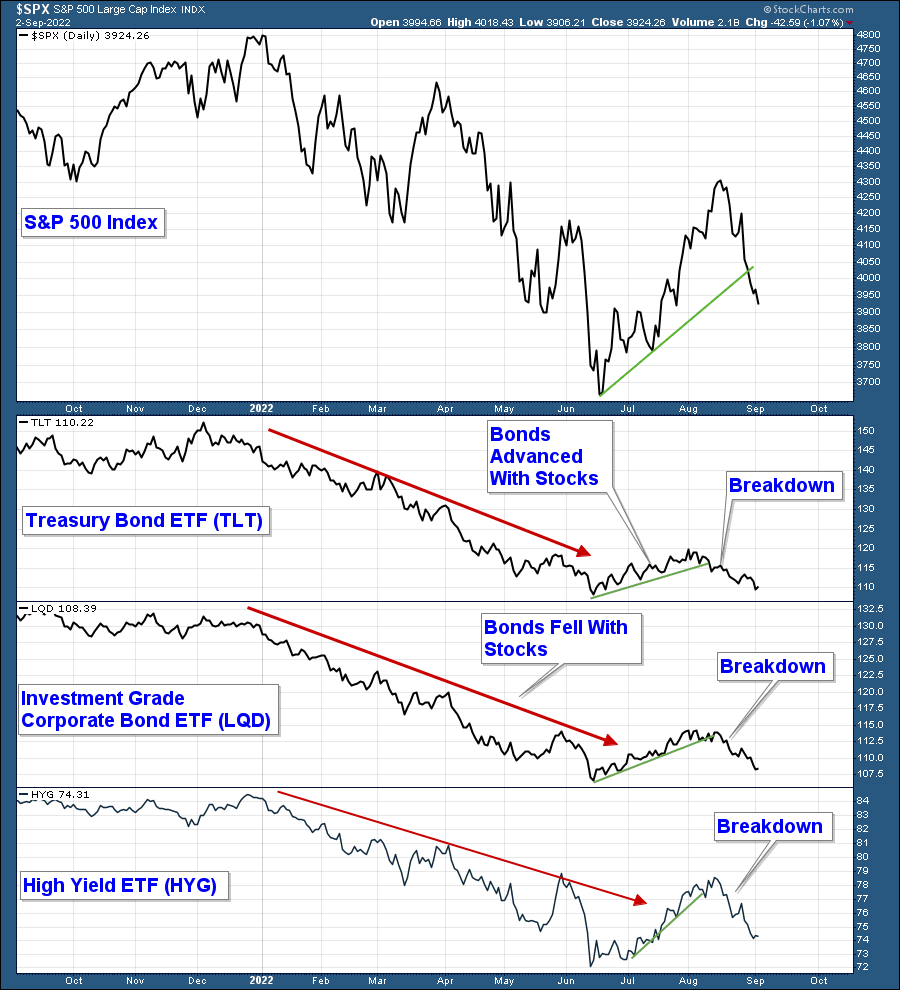
In the past, investors could count on bonds to provide their portfolios with a hedge against falling stock prices. Meaning their bonds would go up in value to partially offset their stock losses.
That is not happening in the current inflationary environment, and it is negatively impacting conservative investors as they see their bonds falling with stocks and adding to those losses.
Below is a chart of the S&P 500 in the top panel and different types of bond funds in the panels below. Bonds have become positively correlated with the stock market as I have notated.
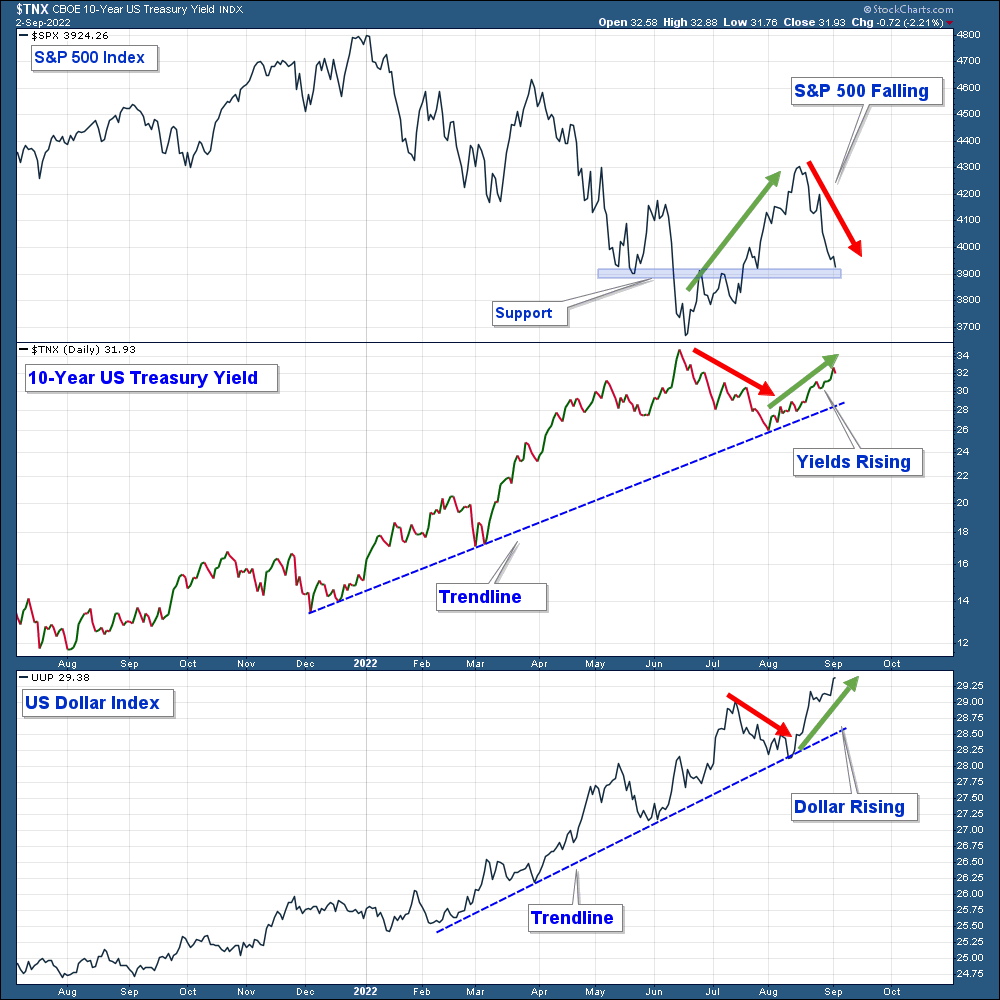
In a recent Twitter post, I wrote about how the Dollar has been negatively correlated with the stock market. At the time, the Dollar was pulling back within an uptrend and I stated that if the Dollar advanced it would be a bearish signal for stocks.
In the chart below is the S&P 500 in the top panel, the 10-Year Treasury Yield in the next panel, and the US Dollar Index in the bottom panel. The recent top in the S&P 500 coincides with the bounce we got in both the Dollar and Bond Yields.
In summary, stocks and bonds are bearish while the dollar and bond yields are in a bullish environment.
The Bottom Line
The bulls are hanging on by a thread. The advance off the June lows has reversed and retraced to a very important support/retracement level. If the market drops decisively below this level, the next level of major support (June lowes) is just over 6% away.
Given that the majority of the technical and economic evidence is bearish, I feel the odds strongly favor more downside for stocks. But as always, let’s keep an open mind and watch the charts.
Client Account Update
The amount of risk we are taking in client accounts has been minimal all year given poor market technicals.
Client accounts are allocated very defensively:
- Large Cash Position
- Long Consumer Staple Stocks
- Long US Dollar
- Long Commodities/Energy
- Short Various Market Indexes
- Short Treasury Bonds
The further the market falls, the greater the future opportunity for those who can minimize losses during this bearish market environment.
CAN WE HELP YOU?
HERE’S AN EASY WAY TO FIND OUT:
We want clients who are a good mutual fit. To find out, we offer a no-pressure complimentary consultation. If we can help you and you want to work with us, that’s great. But if you don’t, we will give you free asset allocation direction on your retirement accounts, at no charge and with no strings attached.
If you are interested, send us an email to set up your complimentary zoom meeting.

Craig Thompson, ChFC
Email: [email protected]
Phone: 619-709-0066
Asset Solutions Advisory Services, Inc. is a Fee-Only Registered Investment Advisor specializing in helping the needs of retirees, those nearing retirement, and other investors with similar investment goals.
We are an “active” money manager that looks to generate steady long-term returns, while protecting clients from large losses during major market corrections.
Asset Solutions may discuss and display, charts, graphs, formulas which are not intended to be used by themselves to determine which securities to buy or sell, or when to buy or sell them. Such charts and graphs offer limited information and should not be used on their own to make investment decisions. Most data and charts are provided by www.stockcharts.com.
Asset Solutions is a registered investment adviser. Information presented is for educational purposes only and does not intend to make an offer or solicitation for the sale or purchase of any specific securities, investments, or investment strategies. Investments involve risk and unless otherwise stated, are not guaranteed. Be sure to first consult with a qualified financial adviser and/or tax professional before implementing any strategy discussed herein. Past performance is not indicative of future performance.