The Bottom Line
Bias:
Positive for Stocks.
• Long-term, stocks are in an uptrend and we are in a bull market.
• When the S&P 500 is hitting all-time highs, international markets are advancing strongly, and market breadth is positive – there is no other way to view the market other than positive!
Client Update
Client accounts are fully invested.
Market Technicals
When evaluating stock market breadth, I like to review the sectors that make up the S&P 500. The sectors that are outperforming/under-performing will say a lot about the health of the market as a whole. If the S&P 500 is hitting new highs while most of the sectors that make up the S&P 500 are displaying weakness, then market breadth is weak and this is a warning sign that the market is not as strong as it seems.
So, let’s look at a chart of each sector and see what clues they give us about the broader market. I will categorize each sector as either Bullish for being in an uptrend/displaying strength or Bearish for being in a downtrend/displaying weakness. Let’s start with those sectors that have the largest weighting in the S&P 500 as of the end of last year and work our way down to those with the least weighting.
If you don’t feel like reading through what I have to say about each sector, you can scroll to the bottom and read the summary.
Technology – 23% (Bullish)
The first chart is the Technology sector which as of the beginning of the year accounted for about 23% of the S&P 500. Below is a chart of XLK (a Technology ETF). XLK hit an all-time high last week and has been advancing within a well-defined up-trending channel. You don’t have to know much about charting to see that XLK is in a strong uptrend.
RSI (lower panel) is a momentum indicator that oscillates between overbought levels (above 70) and oversold levels (below 30). When RSI consistently exceeds 70 but never drops below 30, it is a sign of strong price action which is what has been occurring with XLK since November 2016. Technology has been a market leader all year and with a sector weighting of 23%, this is very positive for the broader market.

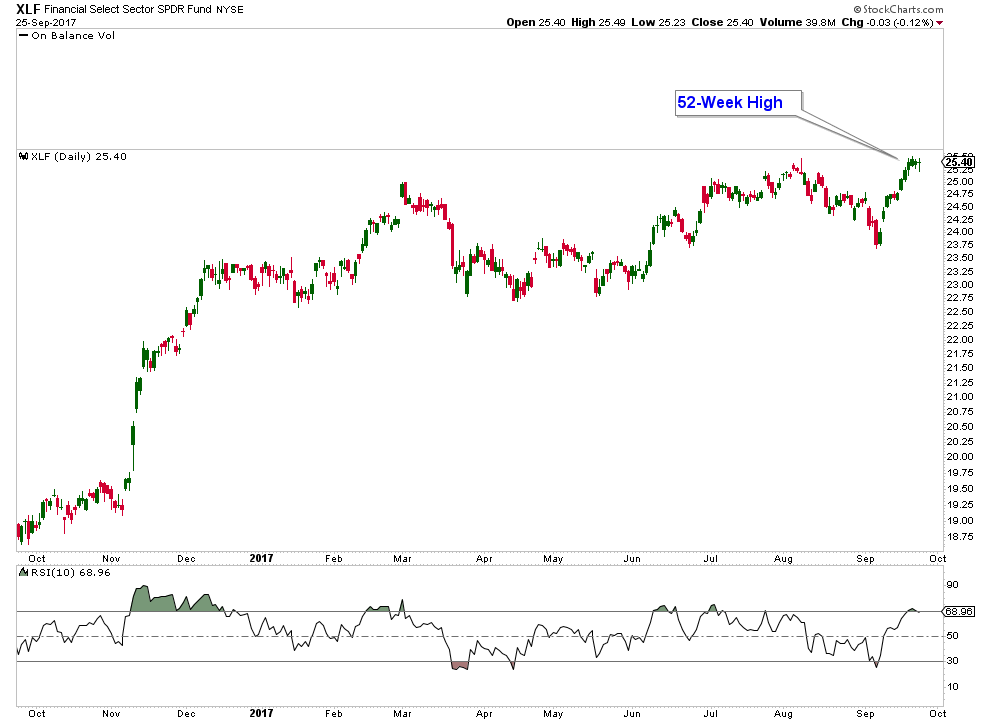
Financials – 15% (Bullish)
While Financials have been under-performing the broader market this year, it is not in a downtrend. In fact, it just hit a 52-week high last week and is starting to display relative strength versus the S&P 500.
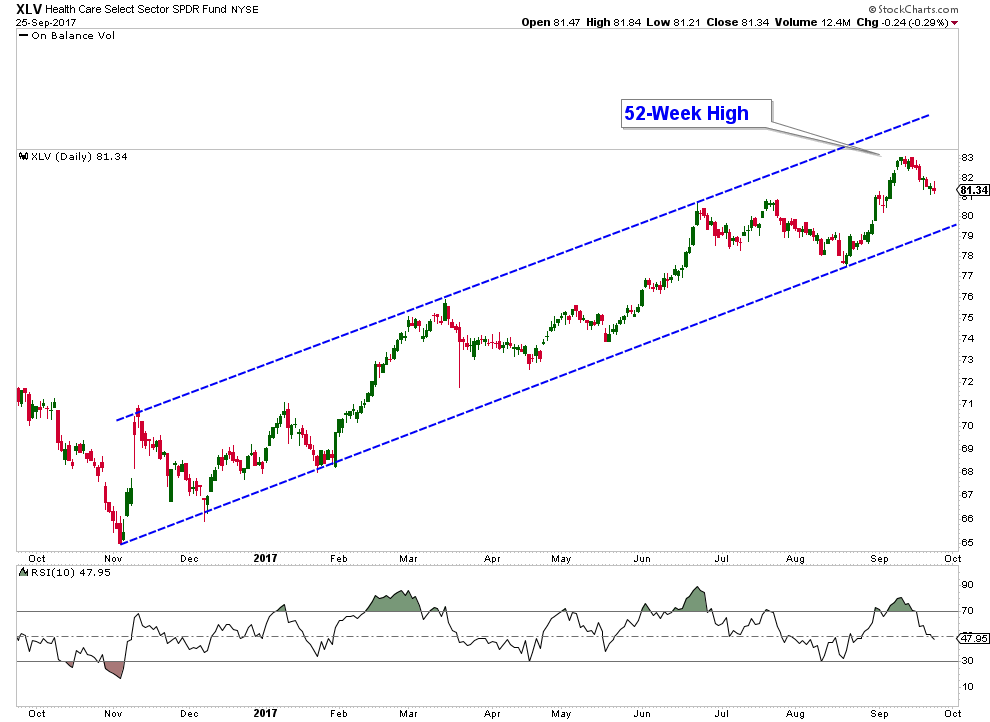
Health Care – 14% (Bullish)
Healthcare has been advancing within a well-defined up-trending channel and hit a fresh 52-week high two weeks ago. In addition, RSI has been exceeding 70 with each advance and hasn’t dropped below 30 since last year. The Healthcare sector looks strong.
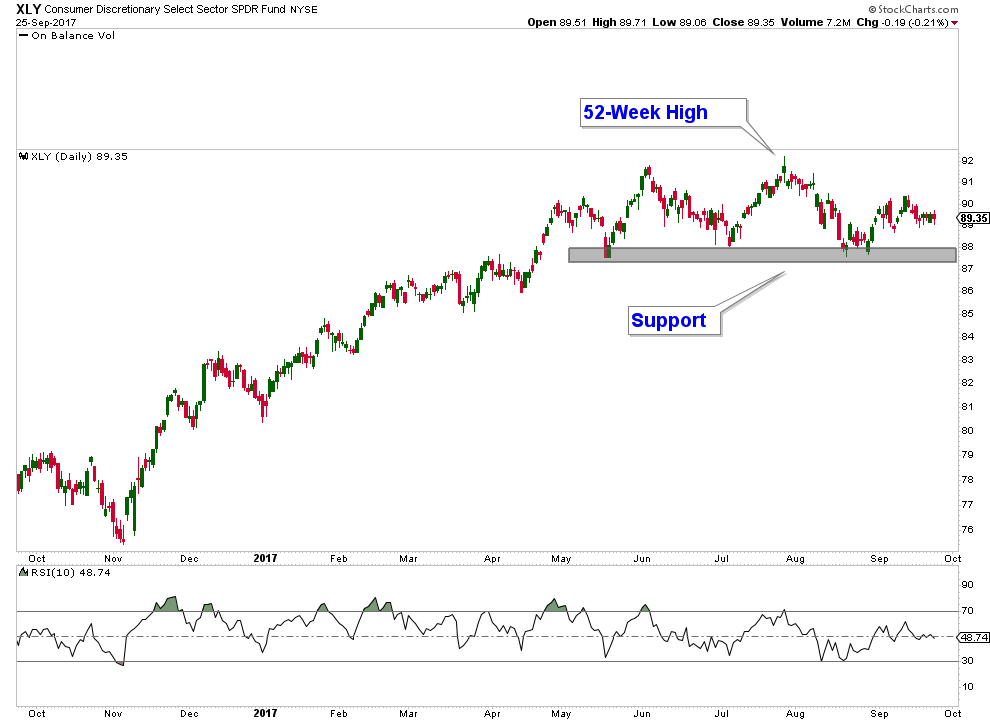
Consumer Discretionary – 12% (Neutral)
Consumer Discretionary (XLY) has not been performing as well as the broader market over the past 4 months; however, it is not in a downtrend. In addition, it hit a 52-week high in July and has been holding above support.
We will need to keep an eye on XLY in the coming weeks to see if it can continue to hold above support. A drop below this level would have some negative ramifications for the broader market. However, the weight of the evidence suggests that odds are higher that it not only holds above support but advances higher with the broader market.
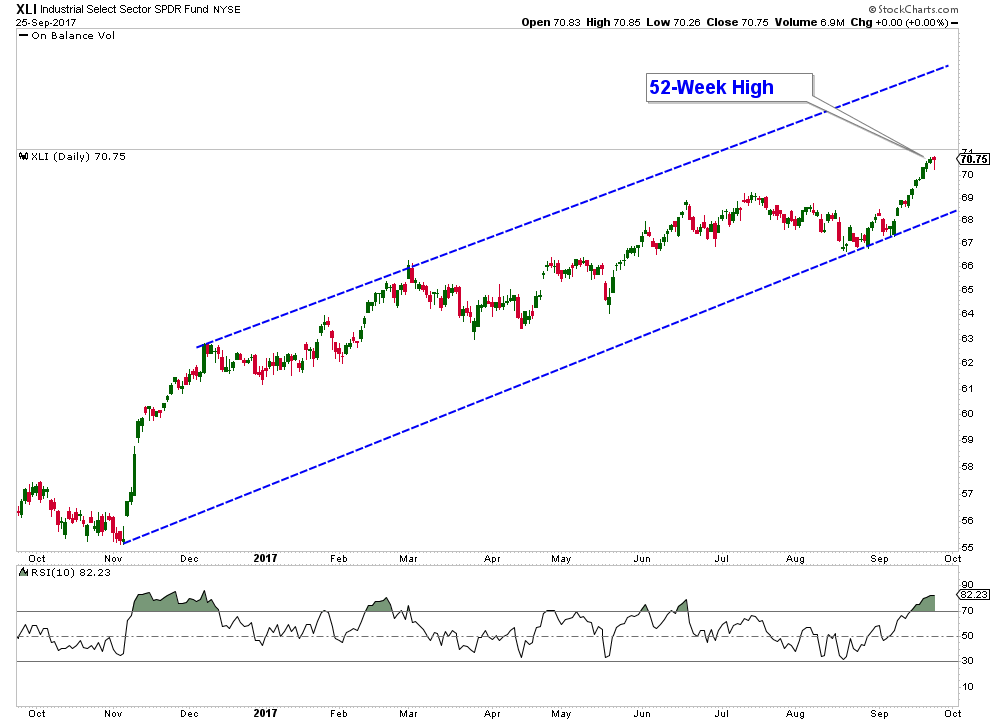
Industrials – 10% (Bullish)
The Industrial Sector is another strong sector. It hit a new 52-week high on Friday. Momentum has been decidedly positive all year which can be seen in the RSI indicator in the lower panel.
Consumer Staples – 9% (Neutral)
While Consumer Staples (XLP) has been trending sideways since February, it has held above support and did hit a 52-week high in June. I believe the main reason that the Consumer Staples sector is under-performing the broader market is that we are in a risk-on environment where investors prefer to invest in higher-risk sectors that have more upside potential. So, under-performance by XLP could be looked at as positive for the broader market.

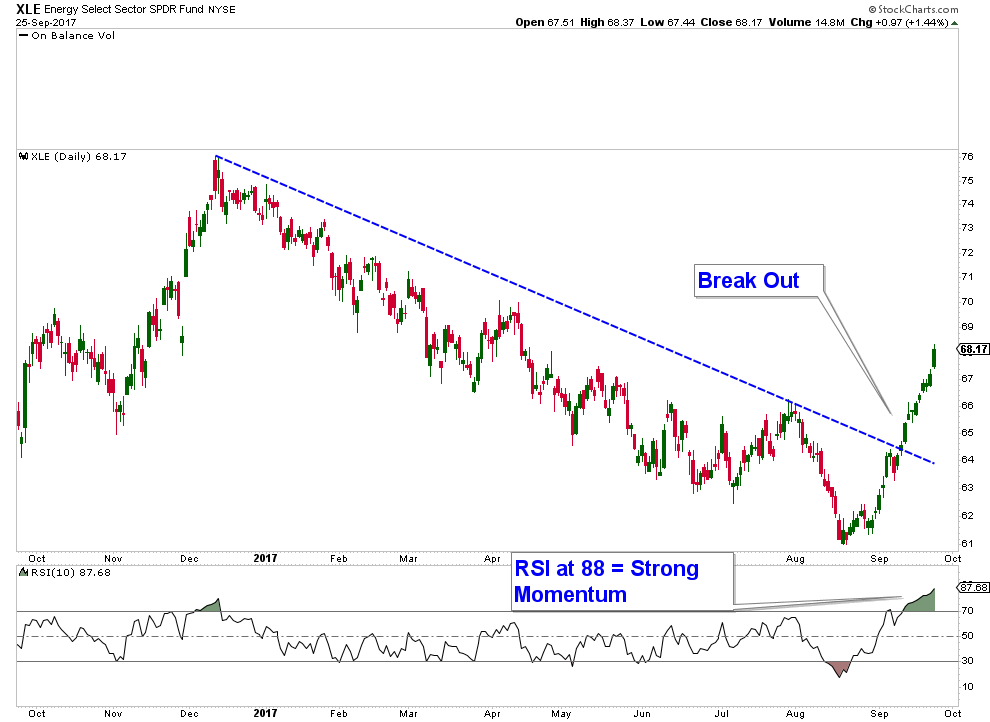
Energy – 7% (Bullish)
Energy has been a lagging sector all year; however, it recently broke out of an 8-month downtrend and is advancing very strongly! RSI is extremely overbought at 88 which is suggesting that the trend for Energy is now up.
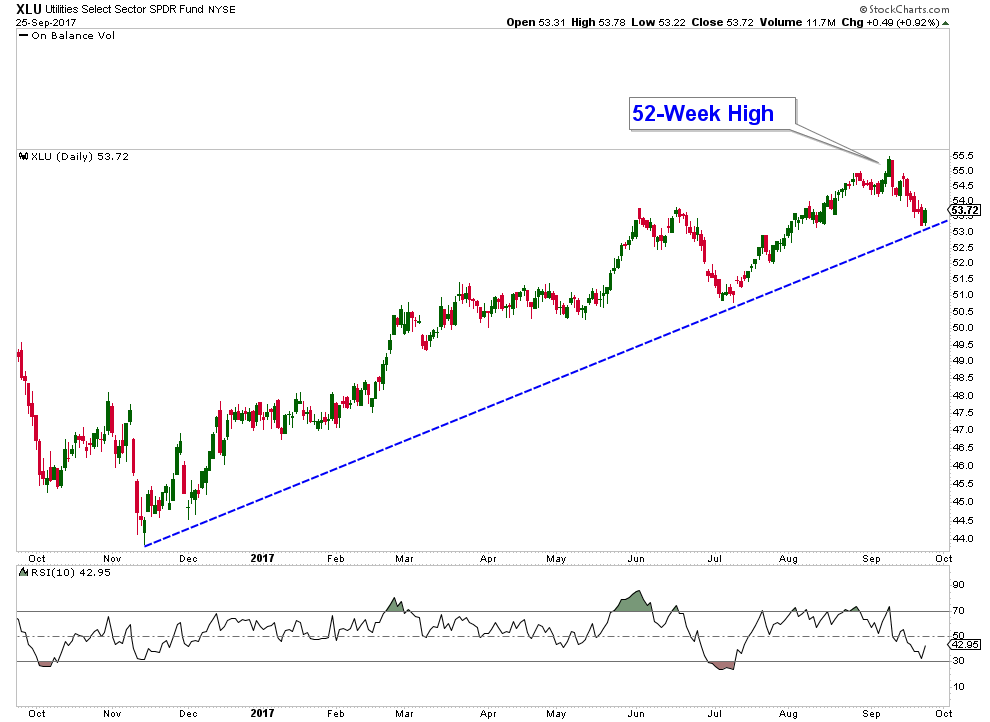
Utilities – 3% (Bullish)
Utilities are trending higher and hit a 52-week high two weeks ago.
Materials – 2.84% (Bullish)
Materials are also in a strong uptrend and hit a new 52-week high last week. RSI looks strong here as well.

For those of you that have followed me for more than the past year and a half know that I am not perpetually bullish on the stock market. If you go back and look at my November 2, 2015 Newsletter – Recent Market Advance Looking Very Suspect you can read about what a market looks like when it is striking distance from hitting a 52-week high, but advancing on very poor breadth and susceptible to a correction. After that newsletter was published, the S&P 500 fell 13.31% (from November 3, 2015 to February 11, 2016). This is not to say that market technicals are always correct and we can rely on them with absolute certainty. However, they do paint a picture and can give us a pretty good idea as to the underlying health of the stock market.
The current market environment is nothing like what we were seeing in November 2015. As you can see from the sector charts above, the majority of the sectors are displaying major strength. Market breadth is therefore positive and this supports my ongoing thesis that we are in a strong bull market.
The weight of the evidence continues to be bullish for stocks. At some point, this will change and when it does, I will have no problem flipping to a bearish bias and reallocating client accounts to a more defensive posture. However, market technicals continue to signal that we are in a bull market and thus we should be invested in stocks aggressively.
If you have any questions, please feel free to contact me.

Craig Thompson, ChFC
Email: [email protected]
Phone: 619-709-0066
Asset Solutions Advisory Services, Inc. is a Fee-Only Registered Investment Advisor specializing in helping the needs of retirees, those nearing retirement, and other investors with similar investment goals.
We are an “active” money manager that looks to generate steady long-term returns, while protecting clients from large losses during major market corrections.
Asset Solutions is a registered investment adviser. Information presented is for educational purposes only and does not intend to make an offer or solicitation for the sale or purchase of any specific securities, investments, or investment strategies. Investments involve risk and unless otherwise stated, are not guaranteed. Be sure to first consult with a qualified financial adviser and/or tax professional before implementing any strategy discussed herein. Past performance is not indicative of future performance.