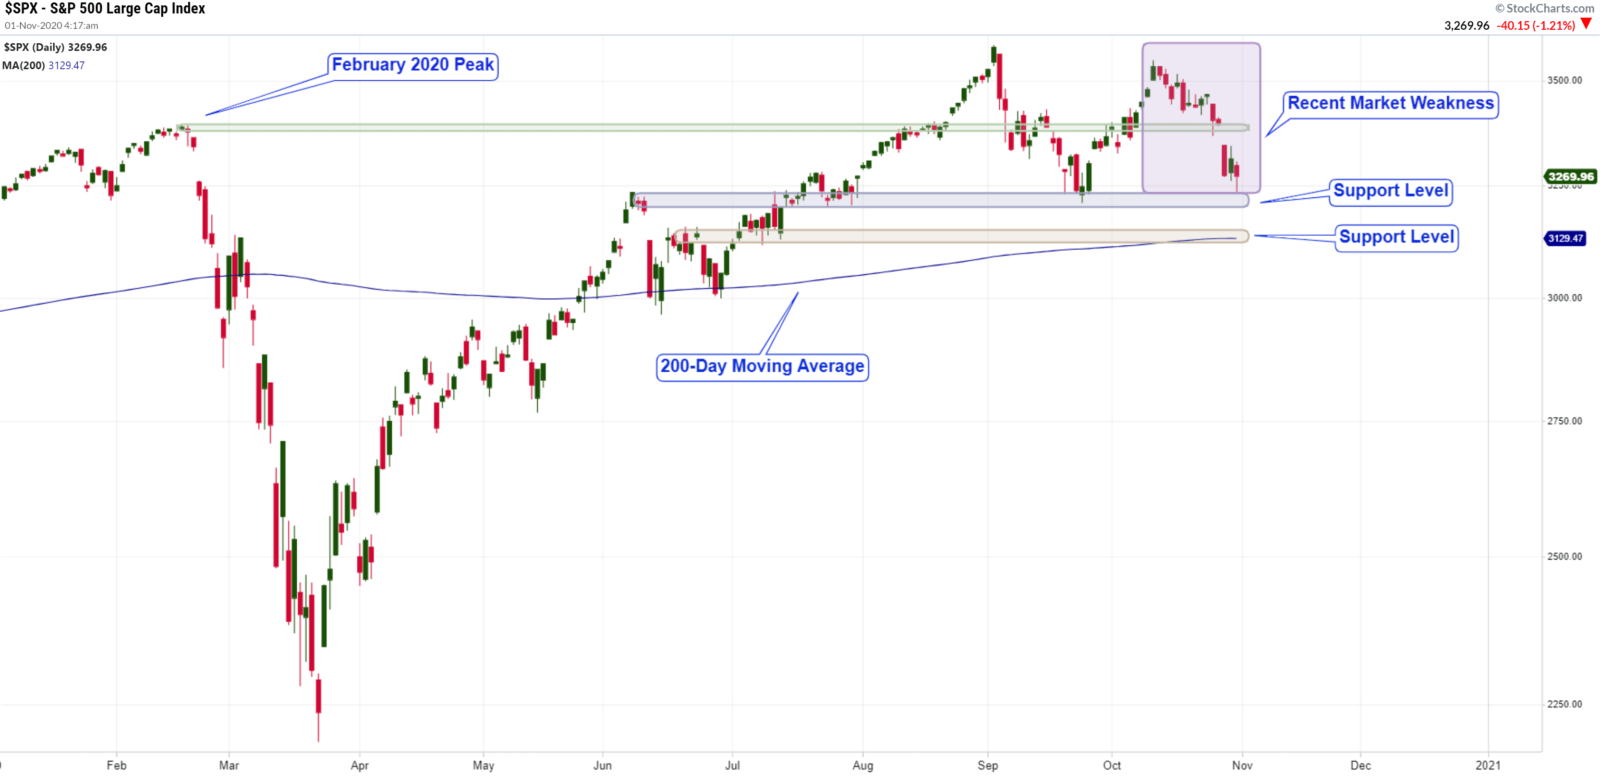
The market has experienced some weakness over the past couple of weeks but not enough to change the primary uptrend that began at the March lows.
Below is a chart of the S&P 500 and price is sitting slightly above support. If the index drops below that first level of support the next support level is the area around the 200-day moving average which is about 4.5% below Friday’s close.
The 200-day moving average is often considered the dividing line between a bull and bear market. If the index makes a strong, sustained move below this level, I would consider longer-term risk to be elevated.
Weight of the Evidence Suggests Limited Decline Before Next Move Higher
Hallmarks of a major market top are complacency, an early move to risk-off assets, and a high degree of correlation seen in stocks after the peak. I am not seeing any of these signs (at least not yet) and thus have to conclude that odds favor recent market weakness likely being temporary in nature and not the beginning of a major stock market correction. With that in mind, let’s look at some charts.
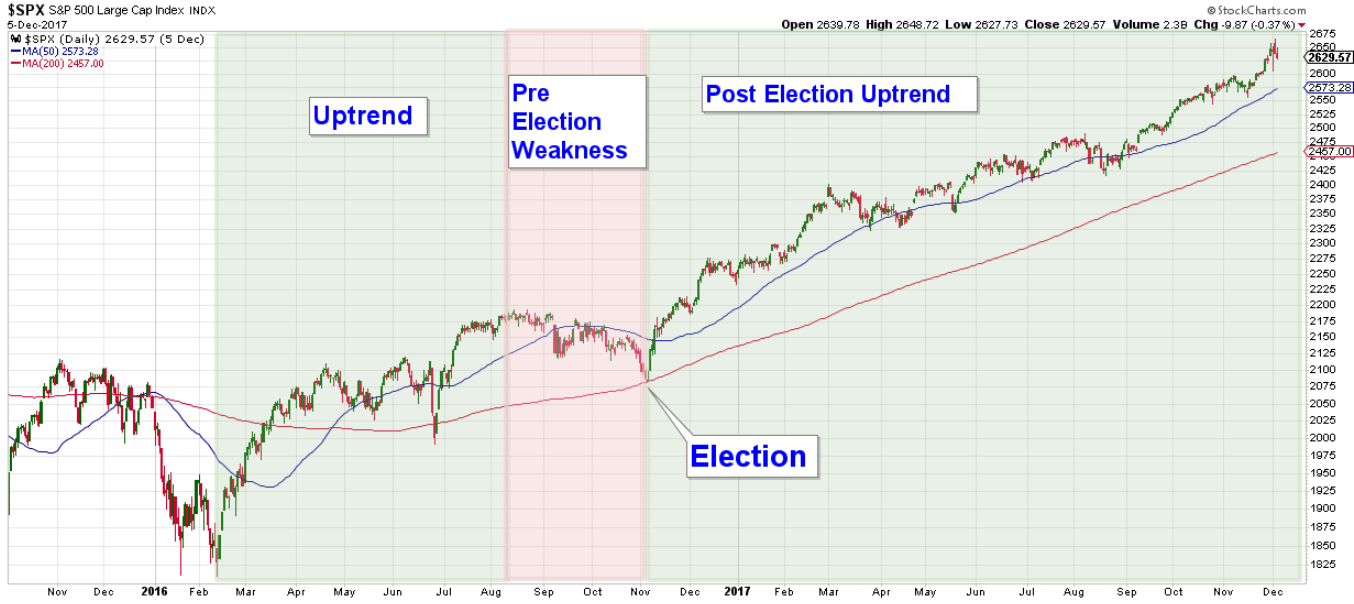
Market action of the past couple of weeks reminds me of what we saw prior to the last election. Below is a chart of the S&P 500 looking back to 2016. Notice how the market was in a primary uptrend that started at the February lows then experienced weakness leading up to the election. Markets hate uncertainty and it is common for stocks to pullback during these periods. Once the election was decided the market advanced higher.
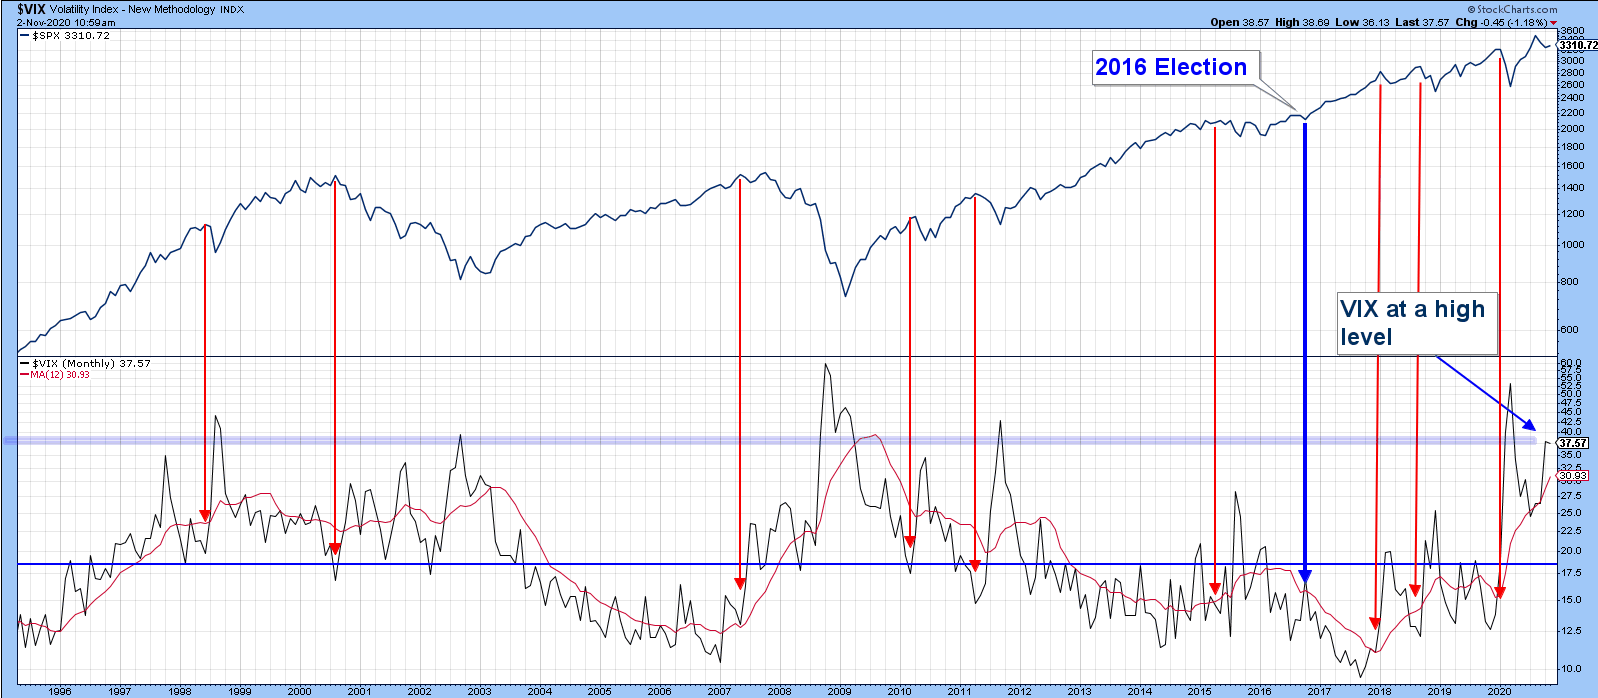
Bull market tops historically occur during times of high complacency that can be charted using sentiment indicators such as the VIX. In the VIX chart below I have placed red arrows at past market peaks going all the way back to the 1990s. Note how each peak in the index occurred when the VIX was below the horizontal blue line, thereby reflecting complacency or a lack of investor fear. Currently, the VIX is comfortably above this line.
Disclosure: This chart was taken from Martin Pring’s recent market update post.
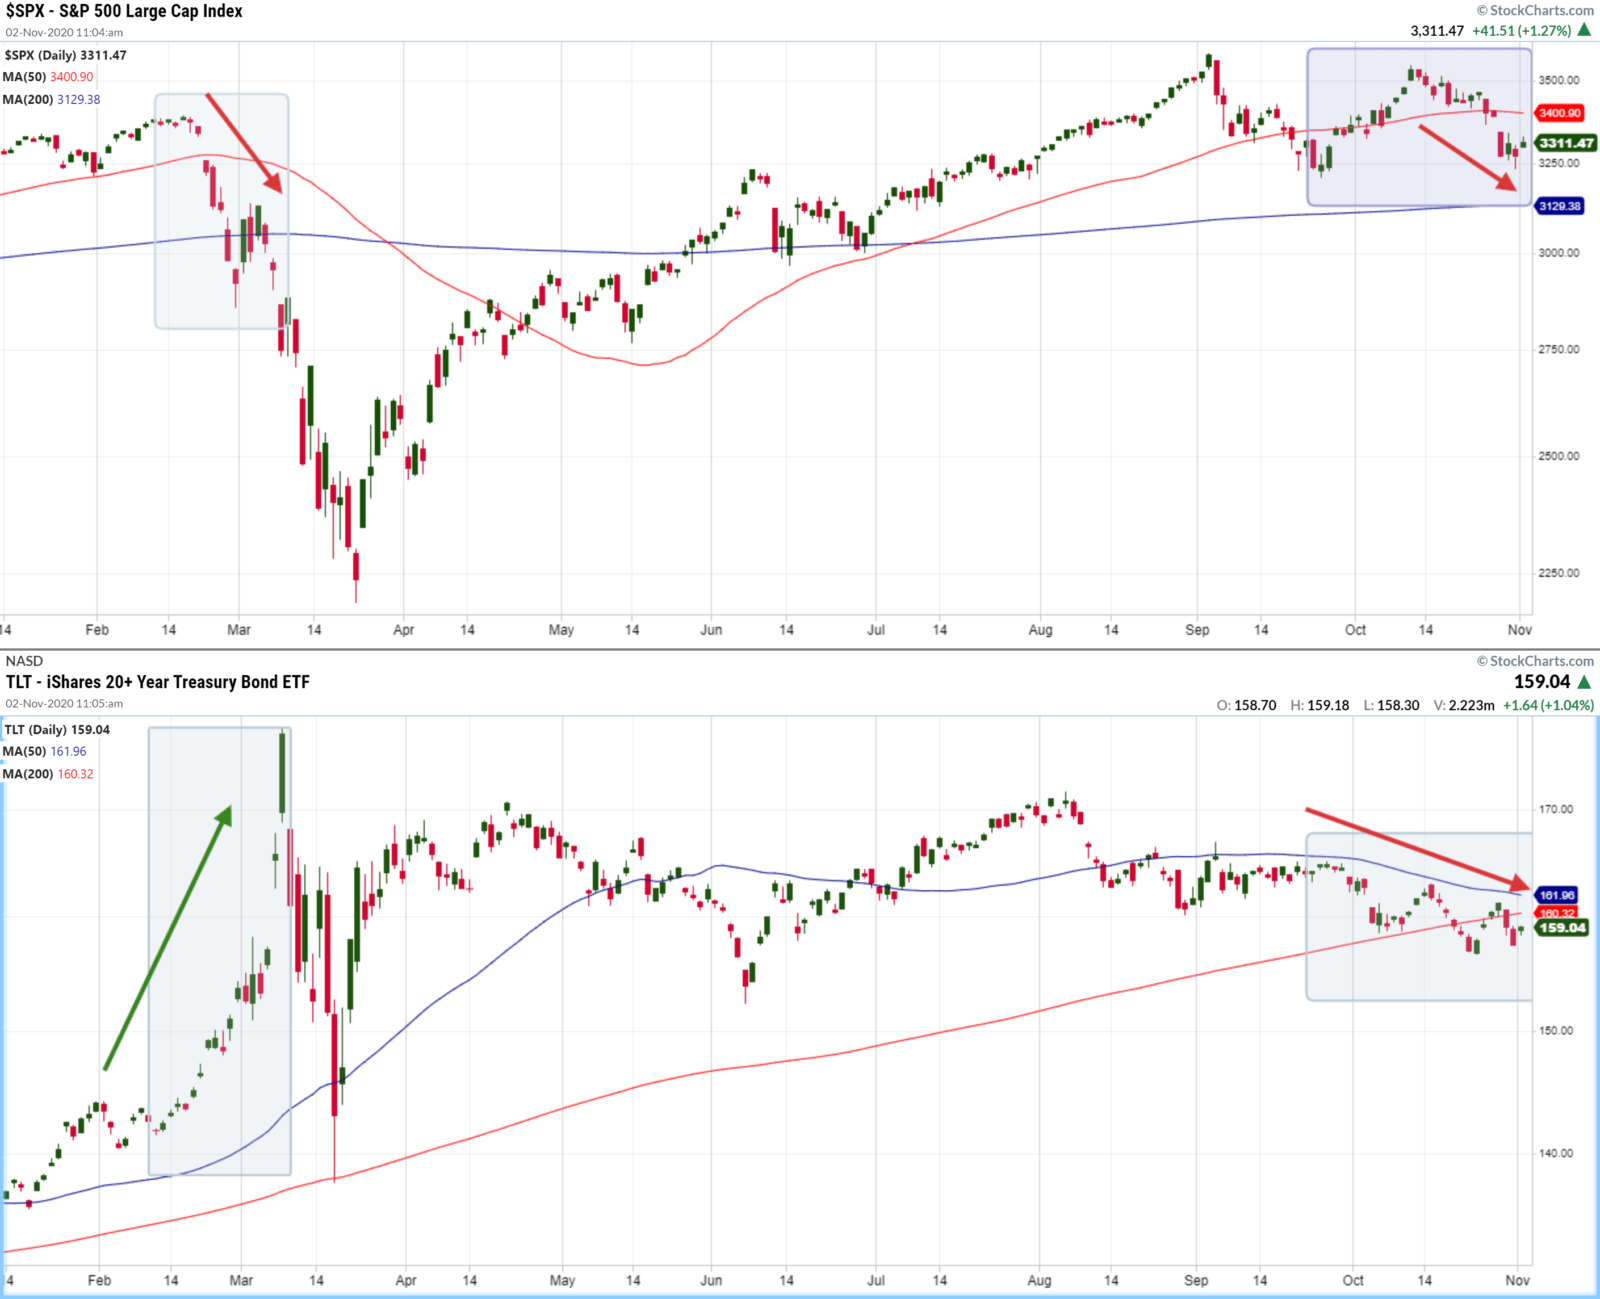
During periods of high stock market stress, you normally see investors move money out of risk-on assets into risk-off assets like Treasury Bonds.
Below is a chart of the Treasury Bond ETF (TLT) in the lower panel and the S&P 500 in the top panel. Notice when the market fell 33% in February TLT initially advanced strongly. This was the result of investors moving money out of stocks into Treasury Bonds which pushed down yields. Now, look at how TLT has performed over the past couple of weeks. TLT has fallen with the market. Thus far, we are not seeing investors moving into the safety of Treasuries.
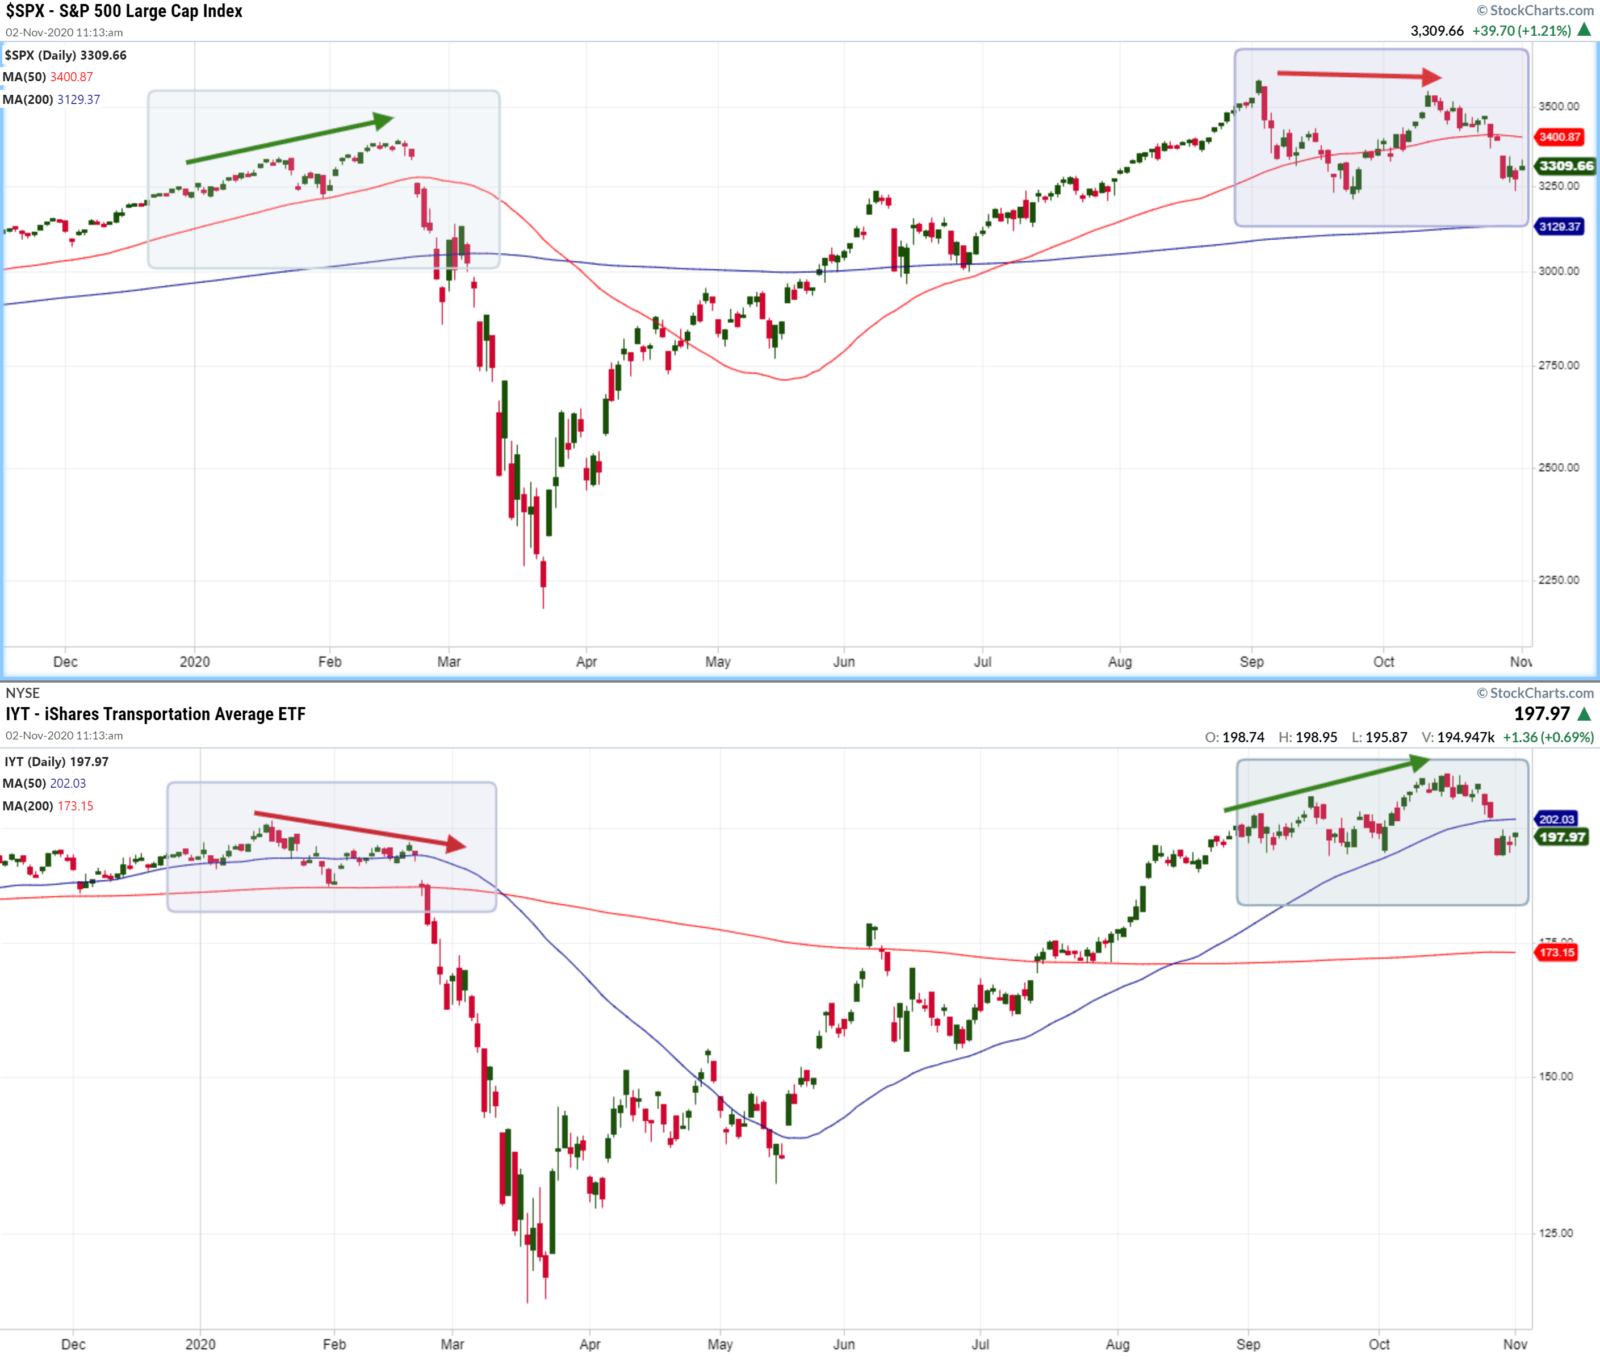
Transportation stocks are economically sensitive and it is common to see this industry group underperform prior to major market peaks. Notice the negative divergence prior to the February high. Now, look at how the index has performed recently. The Transportation Index formed a positive divergence by making new all-time highs in October as the S&P 500 made a lower high. This type of market action is bullish.
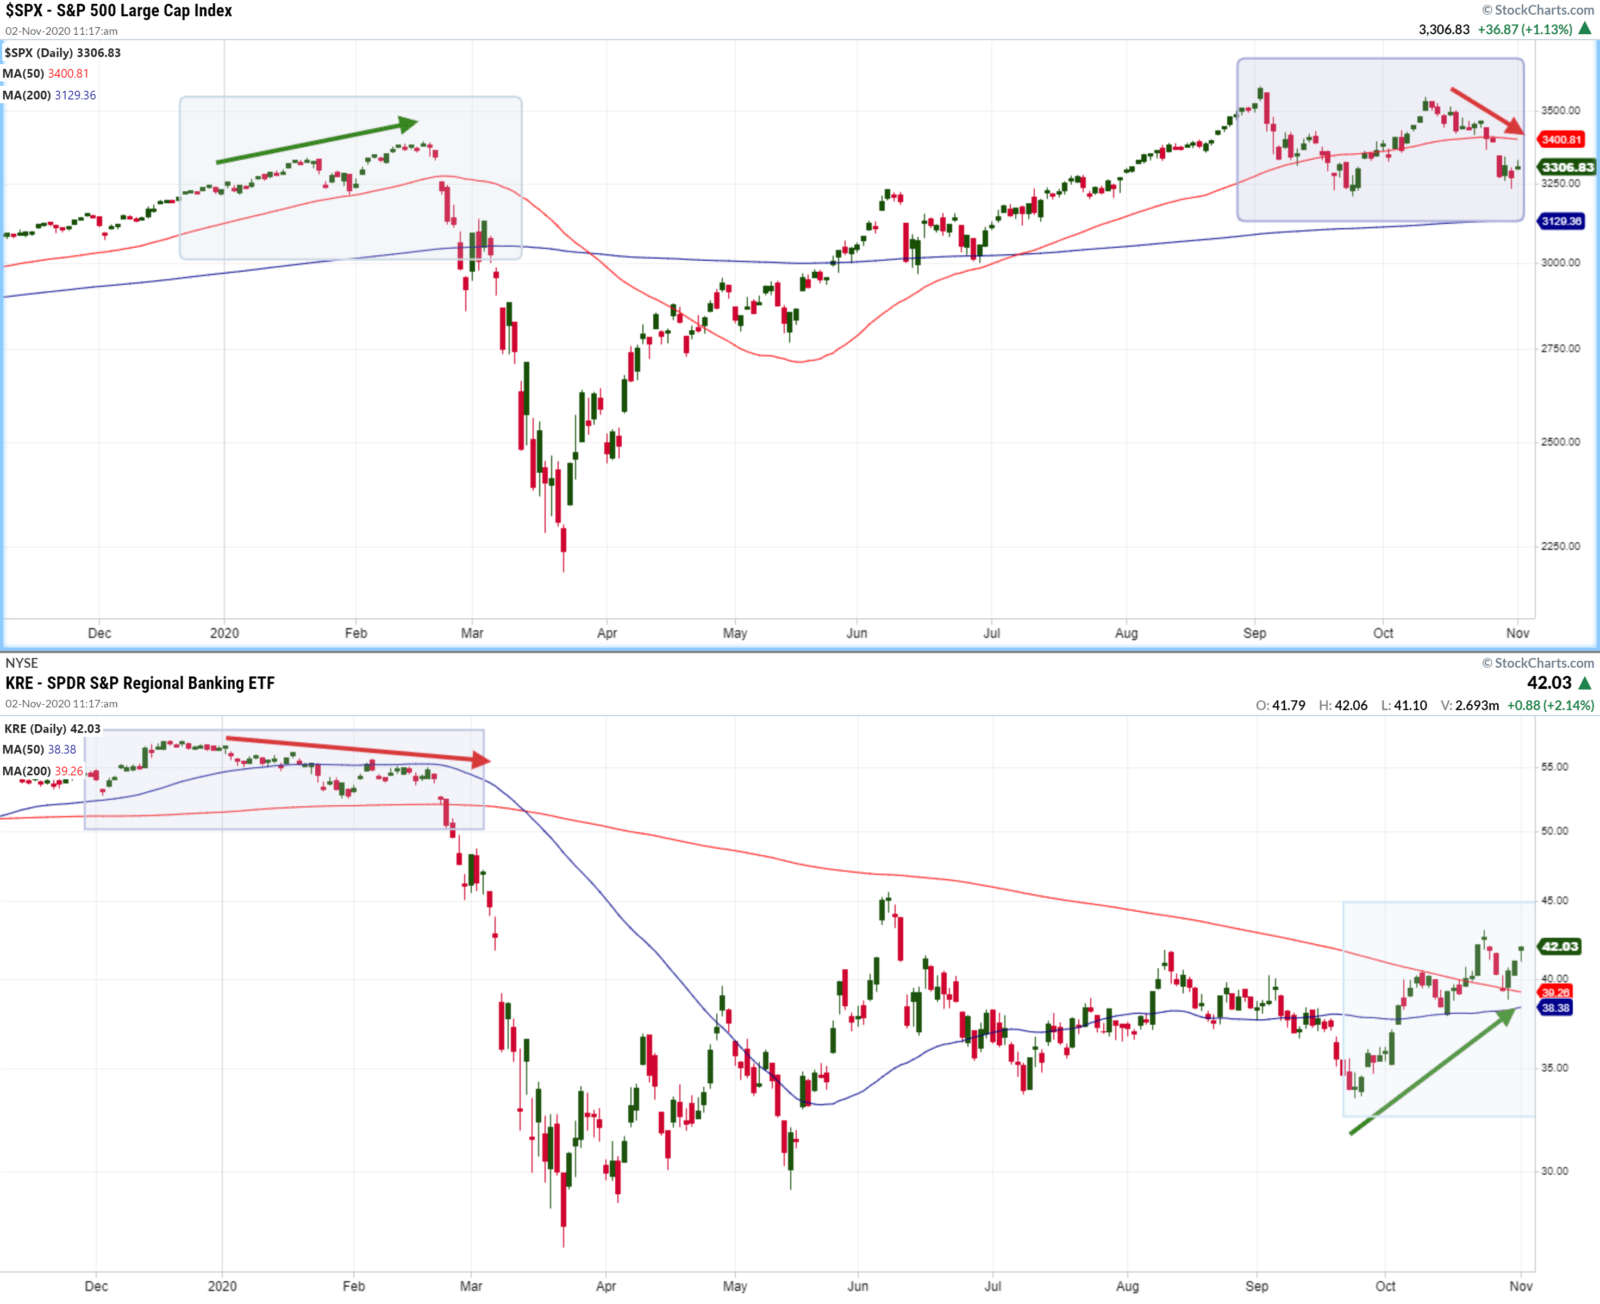
Banking stocks have under-performed during the market recovery mostly due to the current low yield environment. If investors think that we are now heading into another recession or bear market you would expect these stocks to fall in unison with the market. That is not what is happening though, as can be seen in the chart below. The Regional Bank ETF (KRE) advanced in October as the market fell.
Bottom Line
The stock market is experiencing some short-term weakness which based on the weight of the evidence looks more like sector rotation and hedging going into an election. One potential factor that could create some additional market volatility in the near-term is a contested election. Hopefully, that does not happen.
The weight of the technical evidence continues to support our bullish longer-term market thesis.
Client Account Update
Client accounts are fully invested.
As always, managing risk is paramount, and protecting our clients from major losses during severe market corrections is our focus.
If you have any questions, please feel free to send me an email.

Craig Thompson, ChFC
Email: [email protected]
Phone: 619-709-0066
Asset Solutions Advisory Services, Inc. is a Fee-Only Registered Investment Advisor specializing in helping the needs of retirees, those nearing retirement, and other investors with similar investment goals.
We are an “active” money manager that looks to generate steady long-term returns, while protecting clients from large losses during major market corrections.
Asset Solutions may discuss and display, charts, graphs, formulas which are not intended to be used by themselves to determine which securities to buy or sell, or when to buy or sell them. Such charts and graphs offer limited information and should not be used on their own to make investment decisions. Most data and charts are provided by www.stockcharts.com.
Asset Solutions is a registered investment adviser. Information presented is for educational purposes only and does not intend to make an offer or solicitation for the sale or purchase of any specific securities, investments, or investment strategies. Investments involve risk and unless otherwise stated, are not guaranteed. Be sure to first consult with a qualified financial adviser and/or tax professional before implementing any strategy discussed herein. Past performance is not indicative of future performance.
All charts provided by: StockCharts.com