Market Update
I would like to start our May newsletter with a brief explanation of how I analyze markets. Then share with you what that analysis is suggesting about the current market environment. If you are not interested in our process and just want to know what this analysis is suggesting about current market conditions, then toggle down to the section below titled “Current Market Conditions”.
This approach is used to help in our quest to get quality returns while at the same time minimize losses during times of high market stress.
Approach to Analyzing Markets and Managing Risk
To determine a short-term (3-6 months out) broad stock market forecast or market thesis, I evaluate market technicals and determine what the bulk of that data is suggesting about market risk and direction.
Looking out longer-term (1-3 years) I look at the business cycle. Here is my explanation of those two methods of analysis:
Market Thesis determined by a weight of the technical evidence approach. Analysis that will help determine market direction over the next 3 – 6 months.
I start by evaluating what the weight of the technical evidence is suggesting about the health of the stock market. Basically, are we in a bullish, bearish or something in between type of market environment. This knowledge is used to determine investment risk. During times of market stress (bearish market environment) risk is high, and thus I will minimize risk in our client accounts by going to a more defensive allocation.
There is no single indicator that you can look at to determine the future direction of the stock market with 100% accuracy. Therefore, I believe that it is best to look at multiple technical factors and determine what the majority of that evidence is suggesting about markets. When I am formulating my market thesis, I look at a number of different market technicals, such as:
- How are international markets performing?
- What is the price action of the various domestic market indexes? Are they in uptrends, downtrends, or consolidations?
- Market Breadth – Is the majority of market breadth indicators bullish or bearish?
- Intermarket Analysis – Evaluating more than one related asset class or financial market to determine the strength or weakness of the financial markets or asset classes being considered.
This analysis tells me what the markets are likely to do over the intermediate (3 – 6 months) term. If my market thesis is bullish, I will typically be fully invested. On the other hand, if my market thesis is bearish I am going to reduce risk in our portfolio which can mean I increase our allocation to cash and bonds, tighten the stops on our stock holding, and be more apt to take profits.
Business Cycle Analysis – Looking 1-3 years out.
Forecasting out longer than 6 months is more difficult and usually less accurate; however, it can be done if we look at things on a more macro level. Instead of looking at market breadth, price action and other things that will drive the market in the short-term, we have to look at the business cycle.
There are six stages of the business cycle and each phase determines which asset classes do well or poorly. Below is a chart that I copied from Martin Pring’s book: The All-Season Investor. Martin Pring is a world renown technician who has written many books and I still follow his work today.
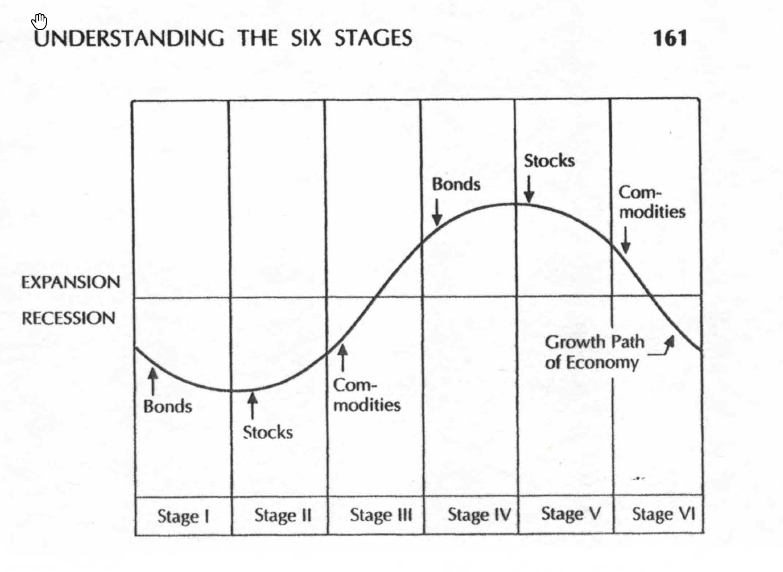
In the chart above, the sine curve represents the growth path of the economy over a full cycle. A full business cycle can take many years to get through, and thus presents a much longer look at asset class performance than the 3-6 months that I normally focus on in my newsletters. The arrows refer to the peaks and troughs of the stock, bond, and commodity markets. Certain asset classes usually peak or bottom during certain stages of the cycle. Because of this, knowing what stage we are in is very important.
This chart implies that each stage is similar in length and in reality they are not. A single stage can last for months or can last for years. Also, there are times when some markets fall out of sequence. However, there is a relationship that different assets have with the business cycle and these relationships influence performance. This is very important knowledge to have when allocating investment accounts!
The bottom line is that the economy does not always expand. Recessions happen regularly. That is just how markets work.
Current Market Conditions
Weight of the Evidence Market Thesis: Bullish in the near-term.
The majority of the technical evidence continues to be bullish for the broader stock market. For example, market breadth is positive, international markets are advancing, risk-on assets have been leading (Semiconductor Index ETF’s have strongly broken to new all-time highs), and most stock market indexes and sectors are trending higher above their 200-day moving averages.
Below is a chart of the S&P 500 (our market proxy). As you will notice, it fell almost 20% last year and is now near the levels that were hit twice in 2018. Even though it is sitting at resistance, I feel that the weight of the evidence is bullish for stocks in the near-term.

Business Cycle: Nearing the end of the current period of economic expansion
Things are not as rosy when looking at the business cycle. We are over 10 years into the current period of economic expansion. The last recession was back in 2008. We are probably nearing the end of the cycle and thus the next recession is probably not that far off. Keep in mind that historically the largest drops in the stock market typically occur during recessions. Let’s not forget that the last two recessions saw the market fall by about 50% – 55%.
In summary, near-term odds continue to favor further stock market gains, however, longer-term there is a risk of a major market correction as a result of economic contraction.
Client Account Update
All client accounts are fully invested in stocks and bonds. The majority of our clients are in or near retirement, so their fully invested equity exposure is, on average, around 50% – 60%. That equity exposure will typically be on the high side when macro market technicals suggest low stock market risk (bullish market environment) and on the low side when those technicals are bearish. During periods of severe market stress, we have frequently lowered our equity allocation all the way down to 0%.
Currently, our conservative accounts have about 66% of their account allocated in stocks or stock funds. This allocation to equities is on the high side because the weight of the macro evidence is bullish (in our opinion).
Summary of How I Manage Client Accounts:
- I do not use a buy-and-hold approach like most financial advisors. I believe this strategy, while good for young investors, can have severe adverse consequences for those in or near retirement.
- I use technical analysis to manage risk and preserve principal during major stock/bond market corrections.
- I have two basic models that I use to manage client accounts. One is conservative and appropriate for investors that are in or near retirement, and an aggressive model for younger more aggressive investors.
- I am a risk manager and will increase our risk level when risk in the market is low, and decrease our risk when risk in the market is high.
If you have any questions, or if you want me to review your retirement account allocations, please feel free to contact me.

Craig Thompson, ChFC
Email: [email protected]
Phone: 619-709-0066
Asset Solutions Advisory Services, Inc. is a Fee-Only Registered Investment Advisor specializing in helping the needs of retirees, those nearing retirement, and other investors with similar investment goals.
We are an “active” money manager that looks to generate steady long-term returns, while protecting clients from large losses during major market corrections.
Asset Solutions is a registered investment adviser. Information presented is for educational purposes only and does not intend to make an offer or solicitation for the sale or purchase of any specific securities, investments, or investment strategies. Investments involve risk and unless otherwise stated, are not guaranteed. Be sure to first consult with a qualified financial adviser and/or tax professional before implementing any strategy discussed herein. Past performance is not indicative of future performance.