The Bottom Line
Bias: Positive for stocks and High Yield Bonds
- While stocks are short-term overbought, and could pullback to some degree, a pullback would be viewed as a buying opportunity as long as the lows of early November are not violated.
- Market internals are positive and odds favor higher stock market prices.
- Treasury Yields are in a steep advance that has Treasury Bond prices in a strong downtrend.
Client Update
Client accounts are fully invested and margin accounts are slightly leveraged. We are invested in Equities, High Yield Bond Funds, Emerging Market Bond Funds, and Floating Rate Bond Funds.
Market Technicals
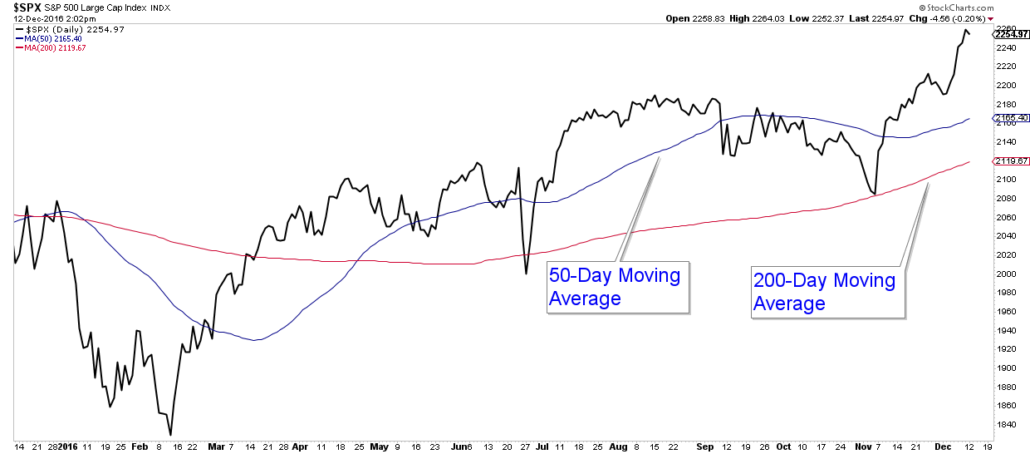
Stock Market Price Action – (Positive)
The stock market continued to surge higher advancing a little over 3% last week.
The S&P 500 is above both it’s 50 and 200-day moving averages and both those averages are trending higher. This is characteristic of positive stock market action.
Stock Market Momentum – Positive (Short-Term Overbought)
The Force Index, which is a volume-based momentum indicator, turned positive in early November as signaled by a move up above the zero line. As you will notice in the chart below, the Force Index has done a good job of confirming market advances and declines.

The strong upsurge in stocks has created a short-term overbought condition, as can be seen by the RSI Indicator in the chart below. In the past, when this indicator has gotten near or exceeded the 70 level (notated with red vertical lines), historically stocks have pulled back to some degree.
I am not overly concerned about this condition, in that short-term pullbacks are a healthy part of a longer-term uptrend and we are not getting a deterioration in other market internals (such as market breadth) that would warn of a more substantial change in trend. 
Stock Market Breadth – Positive
Below is a chart of the NYSE Summation Index (in the top panel) and it is trending up and is above its 10-day moving average.

Another breadth indicator that is displaying a positive bias is the Bullish Percent Index (Bottom Panel in the Chart Below). As you can see, the index is trending higher and has not yet hit the levels that it reached earlier this year.

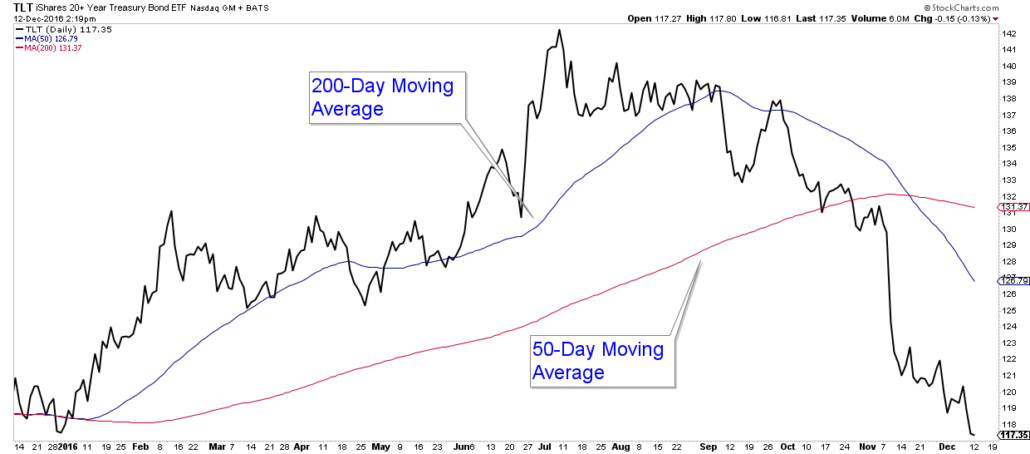
Treasury Bond Update – Negative
While stocks have been trending up, Treasury Bonds have been in a steep downtrend. Below is a chart of TLT (a Treasury Bond ETF), and it has lost about 17% from its peak on July 8th through today’s market close.
I recently setup an Asset Solutions Pinterest Page. I will be saving articles that I feel are of interest to those people that are in or nearing retirement. These will include articles on investing, financial planning, and even travel. Please feel free to check it out and follow.

If you have any questions, please feel free to contact me.

Craig Thompson, ChFC
Email: [email protected]
Phone: 619-709-0066
About Asset Solutions
Asset Solutions Advisory Services, Inc. is a Fee-Only Registered Investment Advisor specializing in helping the needs of retirees, those nearing retirement, and other investors with similar investment goals.
We are an “active” money manager that looks to generate steady long-term returns, while protecting clients from large losses during major market corrections.
Asset Solutions is a registered investment adviser. Information presented is for educational purposes only and does not intend to make an offer or solicitation for the sale or purchase of any specific securities, investments, or investment strategies. Investments involve risk and unless otherwise stated, are not guaranteed. Be sure to first consult with a qualified financial adviser and/or tax professional before implementing any strategy discussed herein. Past performance is not indicative of future performance.