The Bottom Line
Bias:
Long-Term Positive and Short-Term Negative for Stocks.
Neutral for Treasury Prices and Other Interest Rate Sensitive Bonds.
- We have seen a deterioration in market internals over the last six weeks. This condition has made it difficult for broad stock market indexes to continue to advance. Until internals improve, stocks will have a hard time finding any traction higher.
- Long-term the stock market still looks strong; therefore, any weakness in stocks that we see in the coming weeks should be viewed as a buying opportunity as long as the lows of early November are not violated.
- Yields look like they have hit a short-term top which is positive for Treasury prices and other interest rate sensitive bond prices. However, this past week did see some deterioration in Treasury prices. We could be at a very important long-term inflection point.
Client Update
Client accounts are fully invested and margin accounts are slightly leveraged.
We are invested in Interest Rate Sensitive Bond Funds, High Yield Bond Funds, Emerging Market Bond Funds, and Floating Rate Bond Funds.
Once stock market internals improve, I will look to reallocate back into equities.
Market Technicals
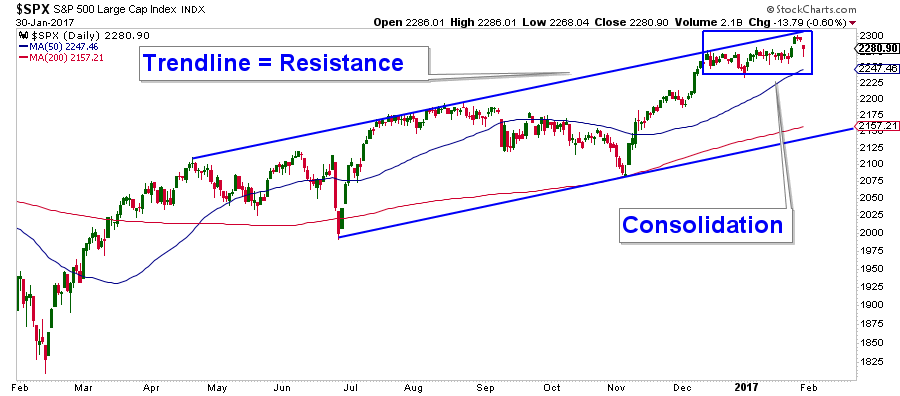
Stock Market Price Action – Positive
The stock market is in a strong uptrend (chart below), however has lost some of its short-term momentum as can be seen in how prices have moved sideways for the past six weeks.
The S&P 500 is above both it’s 50 and 200-day moving averages and both those averages are trending higher. This is characteristic of positive stock market price action.
Stock Market Momentum – Long-Term Positive and Short-Term Negative
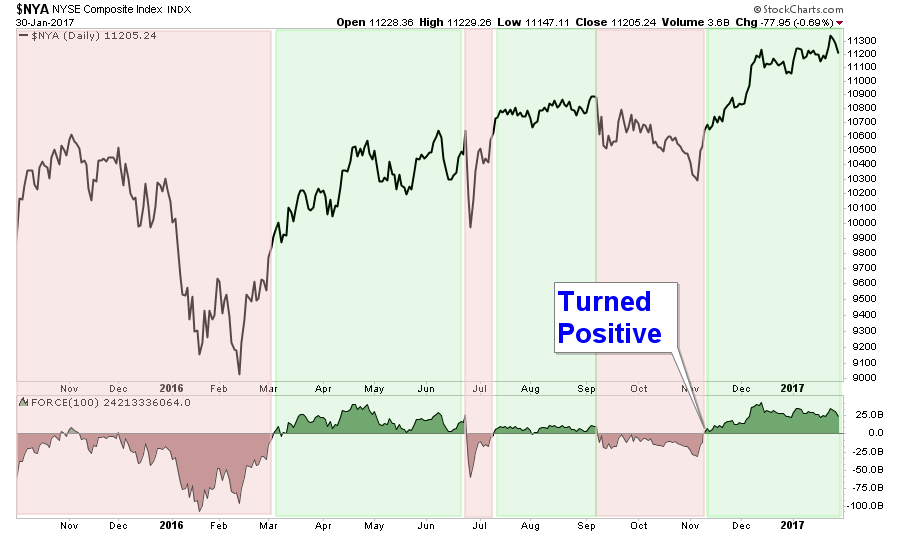
In the lower panel of the chart below is a Force Index, which is a volume-based momentum indicator. We are using a 100-period time frame which is used to confirm longer-term trends.
The index turned positive in early November and is still sitting substantially above the zero line. This suggests that longer-term momentum is positive and any market weakness should be minor unless market internals deteriorate.
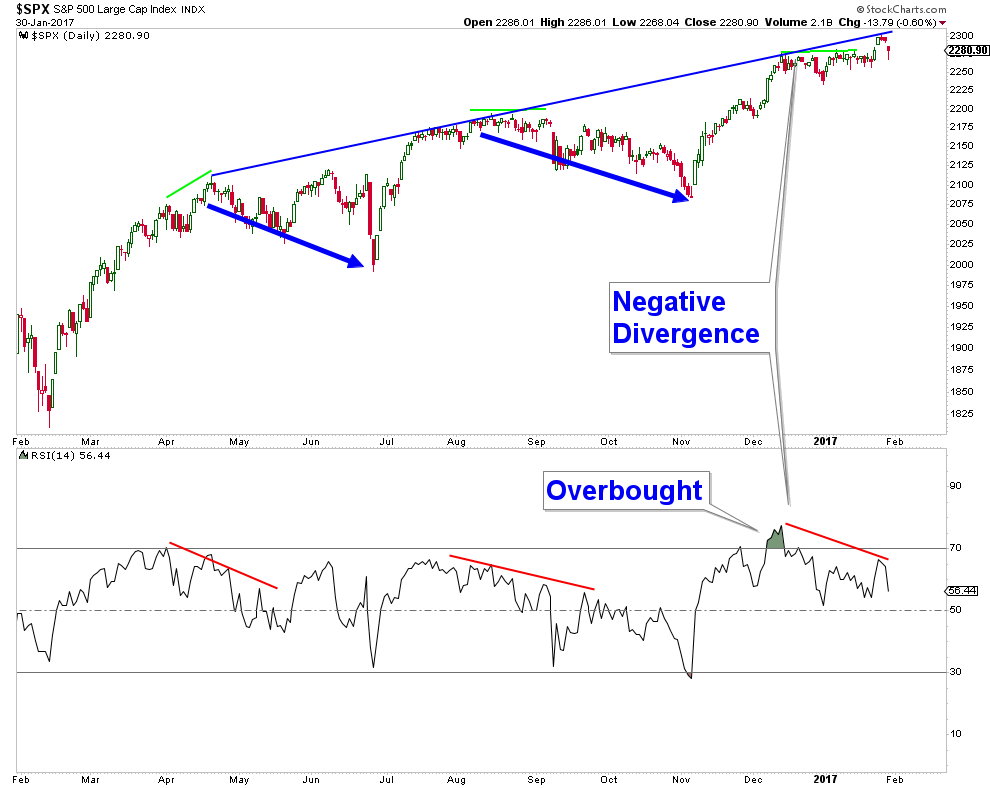
Short-term market internals don’t look as positive. The recent upsurge in stocks has created a short-term overbought condition and momentum is waning.
In the chart below, RSI (a momentum indicator) is in the bottom panel, and you will notice that it hit an overbought level last month which coincided with the S&P 500 leveling off. Also, RSI has formed a negative divergence and when this occurred last year, the market pulled back to some degree.
Stock Market Breadth – Negative
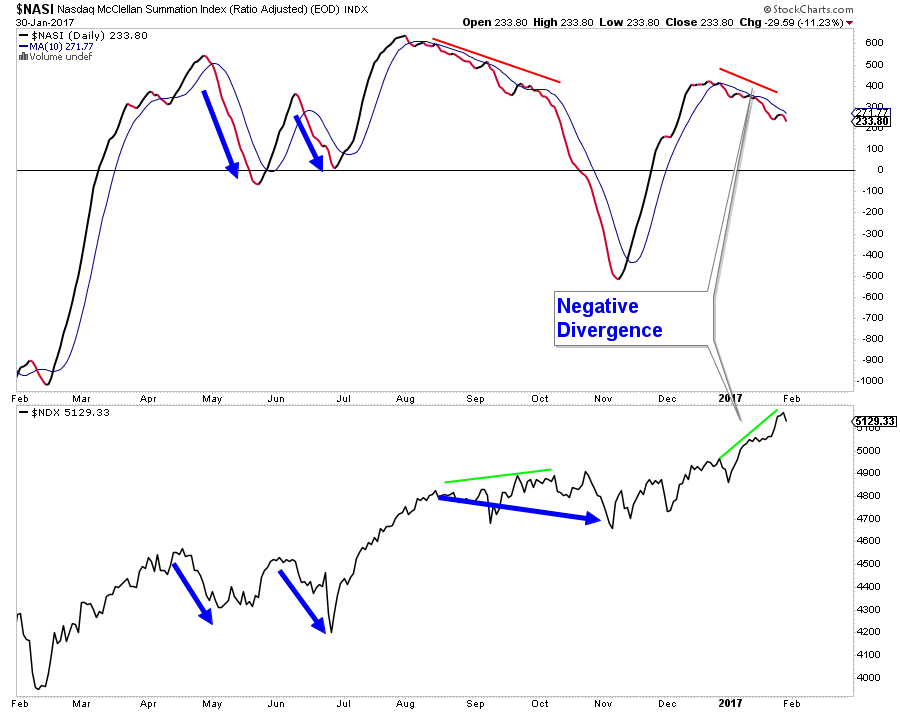
Below is a chart of the Nasdaq Summation Index in the top panel and the Nasdaq in the lower panel. The Nasdaq has been one of the strongest indexes of late, but it’s Summation Index has been falling while price have trended higher.
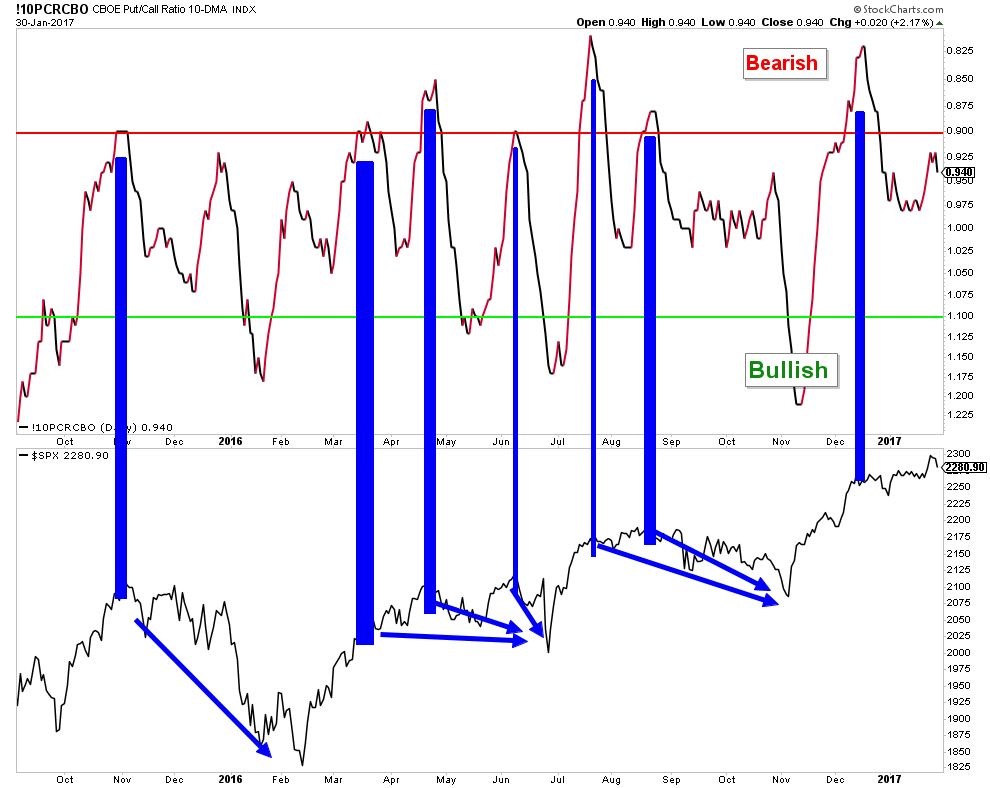
Market Sentiment – Negative
The strong market advance has sentiment warning that stocks are due for a pullback. Below is a chart of the Put/Call Ratio and it has started to fall from an elevated level. Each time this has happened recently, it has accurately warned of near-term stock market weakness.
Seasonality – Negative
February is the 9th seasonally strongest month of the year for the S&P 500.
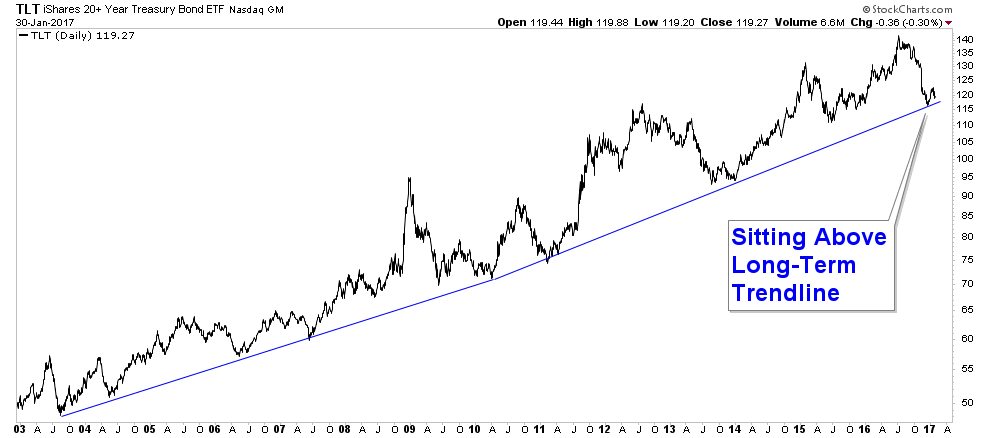
Treasury Bonds and Other Interest Rate Sensitive Bonds – Neutral
Treasury prices are at a long-term inflection point. In the chart below you will notice that Treasury prices have traded above a trendline that goes all the way back to 2003. Actually, it is probably even longer but that is all the data I have for TLT.
If Treasury prices fall decisively below this trendline, it would mean a change in trend that goes back all the way back to the early eighties.
A recent drop in yields has coincided with an advance in Treasury Bond Prices that began mid-December 2016. Below is a chart of TLT (a Treasury Bond ETF). Notice how price bottomed last month and advanced before forming a short-term top a couple of weeks ago. The two momentum indicators below price formed positive divergences which were warning signals that prices were bottoming and due for a bounce.
If Treasury prices are going to transition into a longer-term uptrend, they need to hold above the lows set last month. The pullback in price over the last two weeks has momentum indicators turning over (highlighted with red arrows), which is a red flag.

10 Cities to Retire Overseas in 2017

If you have any questions, please feel free to contact me.

Craig Thompson, ChFC
Email: [email protected]
Phone: 619-709-0066
About Asset Solutions
Asset Solutions Advisory Services, Inc. is a Fee-Only Registered Investment Advisor specializing in helping the needs of retirees, those nearing retirement, and other investors with similar investment goals.
We are an “active” money manager that looks to generate steady long-term returns, while protecting clients from large losses during major market corrections.
Asset Solutions is a registered investment adviser. Information presented is for educational purposes only and does not intend to make an offer or solicitation for the sale or purchase of any specific securities, investments, or investment strategies. Investments involve risk and unless otherwise stated, are not guaranteed. Be sure to first consult with a qualified financial adviser and/or tax professional before implementing any strategy discussed herein. Past performance is not indicative of future performance.