Market Update
Line In The Sand For Stocks Last week I wrote about how the market advanced through a couple layers of resistance and was looking somewhat more bullish. Well the market advanced again this week, and it seems like everyone is now bullish. Even though stock market action has looked very positive of late, I am not buying the bull case just yet.
Small Cap stocks are not confirming these new highs and that is worrisome.
Also, on Friday the S&P 500 closed just above it’s 200 day moving average (dma) after trading below it for the past 46 days. Historically when stocks trade below their 200 dma for an extended time and then advance to touch this average for the first time, they usually fall right back down to some degree.
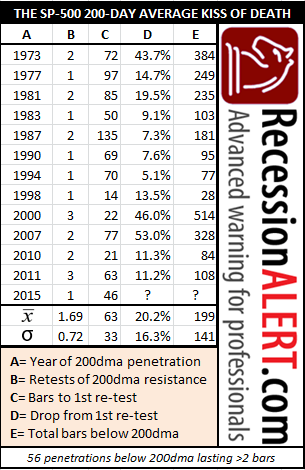
RecessionAlert.com published a study on this phenomenon and here is a summary of what they found:
We examined all protracted visitations of the SP-500 below its 200 dma since 1972. Protracted visitations must satisfy at least one (preferably both) of the following criteria:
1. The 200 dma is pointing downwards or
2. The SP-500 has been below the 200 dma for at least 20 days.
Amazingly, there have only been 13 instances of the initial commencement of “protracted penetrations” since 1972. These are instances when either of the above criteria have been met and there has not been a prior protracted penetration in the last 100 days. They are cataloged below:
Think of it this way: the 200 dma acts as a massive support level on the stock market. Breaches below it are very rare and in the majority of cases, closing above the 200 dma from below is normally a sign of a renewed strong up-leg for the market. Because the 200 dma is such a powerful support level for the SP-500, once we have entered a protracted period below it, it now becomes an equally powerful resistance level. That is why there is at least one failed test of resistance during protracted periods below the 200 dma.
Statistically speaking, 13 events is a very small sample size so take the study with a grain of salt. In addition, there are no guarantees that history implied by the above table will repeat itself. However, stocks are currently overbought, global growth is slowing, and stocks are sitting right on their 200 day moving average for the first time since the August correction. Therefore, it is wise to wait and see if we can get a more desirable entry point with the next correction.
So the market’s ability to stay above it’s 200 dma is a line in the sand of sorts. If it can stay above this level, odds would favor a year end rally in my opinion.
Client Update
Currently, we have most client accounts invested primarily in money market funds. Money market funds are safe investments that do not fluctuate in price and are a good place to park our money while we wait for stock and bond market conditions to improve.
I am looking to evaluate the next pullback. The character of that pullback will determine if it is a good entry point to begin to get back into stocks.
On the other hand, if stocks don’t pullback in the short-term and stay above their 200 dma in the coming week(s), I will have to change my stance and look to move back into stocks without the benefit of a short-term correction