The Bottom Line
Bias: Long-Term Positive and Short-Term Negative for Stocks.
- We have seen a deterioration in market internals over the past week. As a result, the odds that we will see a short-term pullback in stocks has increased.
- Long-term the stock market still looks strong; therefore, any weakness in stocks that we see in the coming weeks should be viewed as a buying opportunity as long as the lows of early November are not violated.
- Treasury Yields are in a steep advance that has Treasury Bond prices in a strong downtrend.
Client Update
Client accounts are fully invested and margin accounts are slightly leveraged. We may look to sell some of our equity holdings to try to buy them back at lower prices if we see further market deterioration.
We are invested in Equities, High Yield Bond Funds, Emerging Market Bond Funds, and Floating Rate Bond Funds.
Market Technicals
Stock Market Price Action – Positive
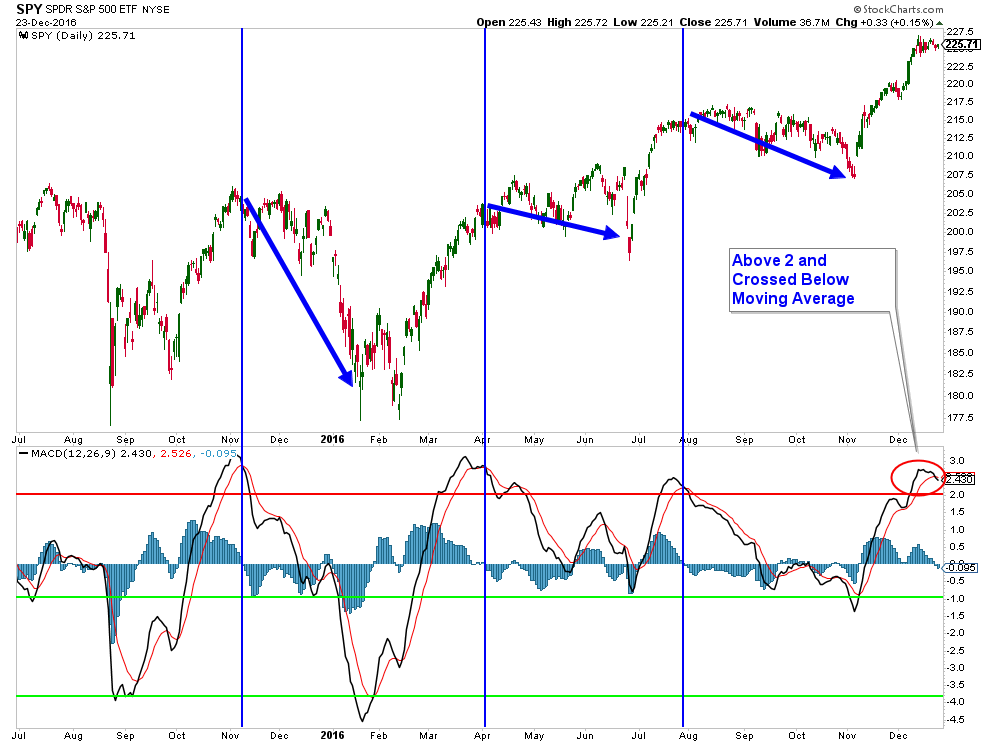
The stock market is in a strong uptrend (chart below), however has lost some of its short-term momentum as can be seen in how prices have moved sideways for the past couple of weeks.
The S&P 500 is above both it’s 50 and 200-day moving averages and both those averages are trending higher. This is characteristic of positive stock market action.

Stock Market Momentum – Long-Term Positive and Short-Term Negative
In the lower panel of the chart below is a Force Index, which is a volume-based momentum indicator. We are using a 100-period time frame which is used to confirm longer-term trends.
The index turned positive in early November and is still sitting substantially above the zero line. This suggests that longer-term momentum is positive and any market weakness should be minor unless market internals deteriorates.

Short-term market internals don’t look as positive. The recent upsurge in stocks has created a short-term overbought condition and momentum is starting to wane.
In the lower panel of the chart below is the MACD Indicator. Notice each time the MACD has advanced above 2 then fell below it’s moving average it has historically marked a period where stocks have pulled back to some degree.
Stock Market Breadth – Negative
Normally we show a chart of the NYSE Summation Index (the second panel from the top in the chart below) and it is trending up and is above its 10-day moving average. However, there are other Summation Indexes that have turned negative and are notated with a red circle.
Market breadth looks like it is beginning to wane. This is a warning that the odds of a stock market pullback are increasing.

Another breadth indicator that recently turned negative is the Bullish Percent Index (lower panel in the chart below). The indicator has turned down and crossed below its moving average from an elevated level. Each time this has occurred recently, the market has pulled back to some degree.

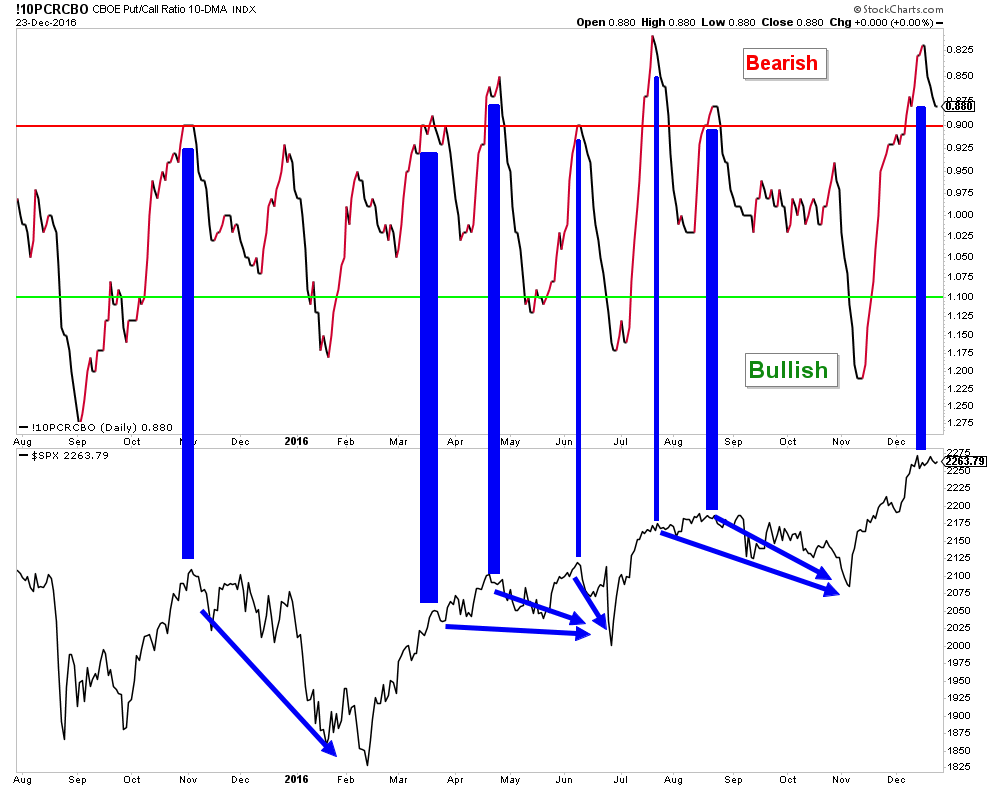
Market Sentiment – Negative
The strong market advance has sentiment warning that stocks are due for a pullback. Below is a chart of the Put/Call Ratio and it has started to fall from an elevated level. Each time this has happened recently, it has accurately warned of near-term stock market weakness.
I hope everyone is having a wonderful holiday season filled with family, good times and great memories!

If you have any questions, please feel free to contact me.

Craig Thompson, ChFC
Email: [email protected]
Phone: 619-709-0066
About Asset Solutions
Asset Solutions Advisory Services, Inc. is a Fee-Only Registered Investment Advisor specializing in helping the needs of retirees, those nearing retirement, and other investors with similar investment goals.
We are an “active” money manager that looks to generate steady long-term returns, while protecting clients from large losses during major market corrections.
Asset Solutions is a registered investment adviser. Information presented is for educational purposes only and does not intend to make an offer or solicitation for the sale or purchase of any specific securities, investments, or investment strategies. Investments involve risk and unless otherwise stated, are not guaranteed. Be sure to first consult with a qualified financial adviser and/or tax professional before implementing any strategy discussed herein. Past performance is not indicative of future performance.