Churning
Stocks have been churning sideways for the past couple of weeks. This is one way for stocks to work off the intermediate term overbought condition that is the result of the strong advance off the Mid-February low. The other way for stocks to digest those gains would be for them to pullback to some degree. Either way, stocks are taking a breather and risk is elevated.
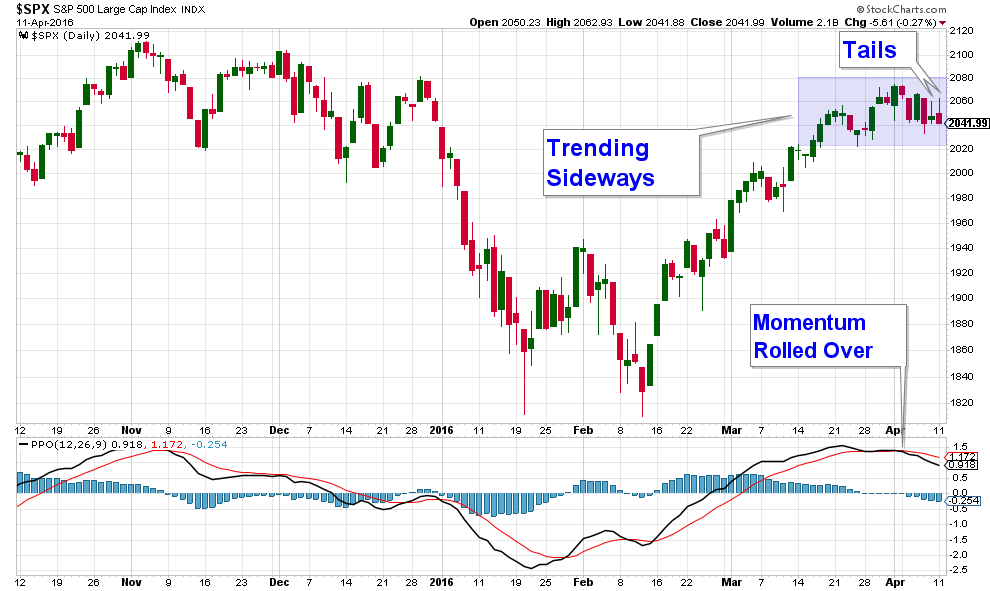
Below is a chart of the S&P 500. The shaded area highlights the sideways market action over the past couple of weeks. The last two candles have tails, which are bearish candle formations, and the momentum indicator in the bottom panel has turned over suggesting a market that is rolling over.
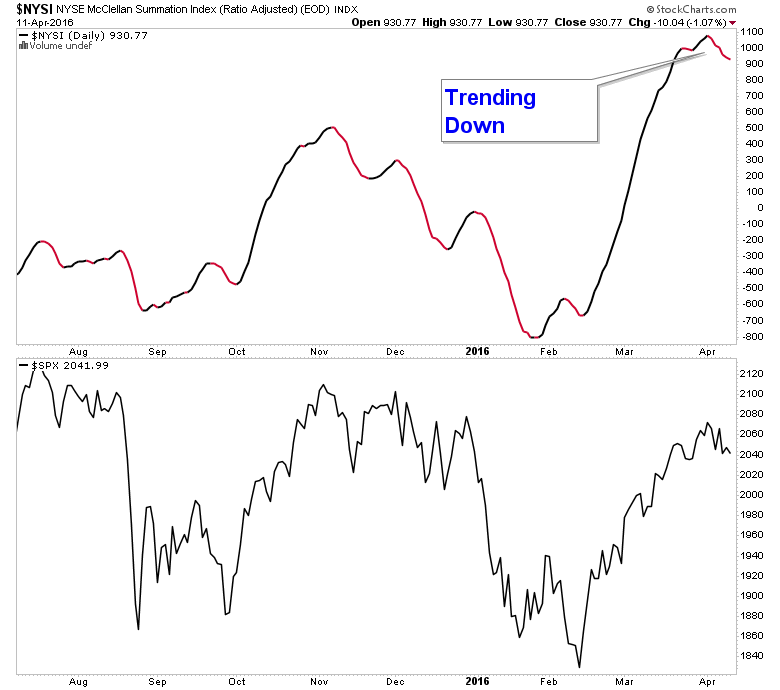
Below is a chart of the NYSE Summation Index (breadth indicator) and it is now trending down. This is usually a very reliable indicator and when it turns down from such high levels, downside risk is elevated.
While stocks have been churning sideways, bonds have continued to trend higher.
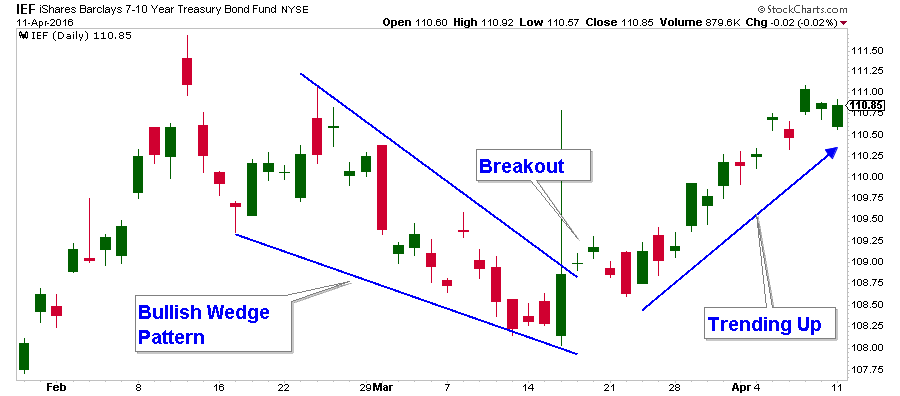
Below is a chart of a Treasury ETF (IEF) and,. similar to the chart of TLT that I showed last week, it has broken out of a bullish wedge pattern and is now trending higher.
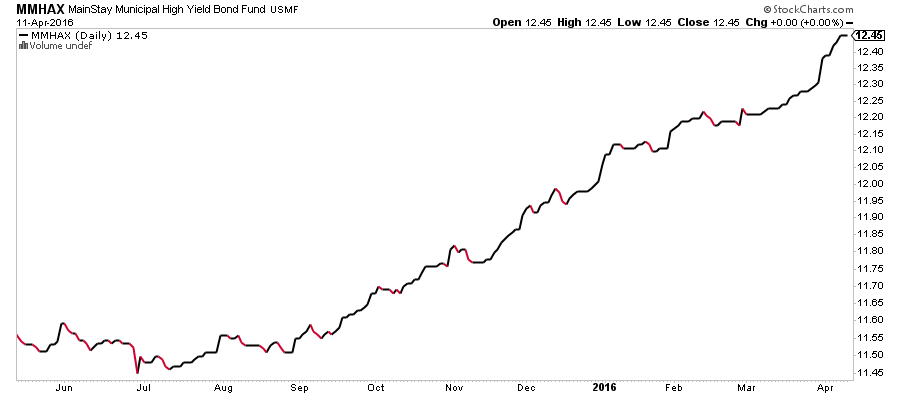
High Yield Municipal Bond Funds are still trending higher with little volatility.
Client Update
Both Aggressive and Conservative accounts are fully invested in Bond Funds.

Craig Thompson, ChFC
Email: [email protected]
Phone: 619-709-0066
About Asset Solutions
Asset Solutions Advisory Services, Inc. is a Fee-Only Registered Investment Advisor specializing in helping the needs of retirees, those nearing retirement, and other investors with similar investment goals.
We are an “active” money manager that looks to generate steady long-term returns, while protecting clients from large losses during major market corrections.