In last months newsletter I wrote:
“Long-term the market continues to look bullish. However, market internals are suggesting that the odds of short-term weakness are increasing.”
Long-term, the market is still in an uptrend. In the chart of the S&P 500 below, notice how the index is above its 50 and 200-day moving averages and both those averages are trending higher. From a pure long-term price perspective, the trend is up.
However, the short-term weakness that I wrote about in last month’s newsletter has continued to build. The trendline that had held since November of last year was violated to the downside. Notice the break below the dashed green trendline.
This trendline break is not a major issue given that the index is still above its moving averages; however, I do view it as a warning sign when coupled with the continued deterioration in market sentiment and breadth.

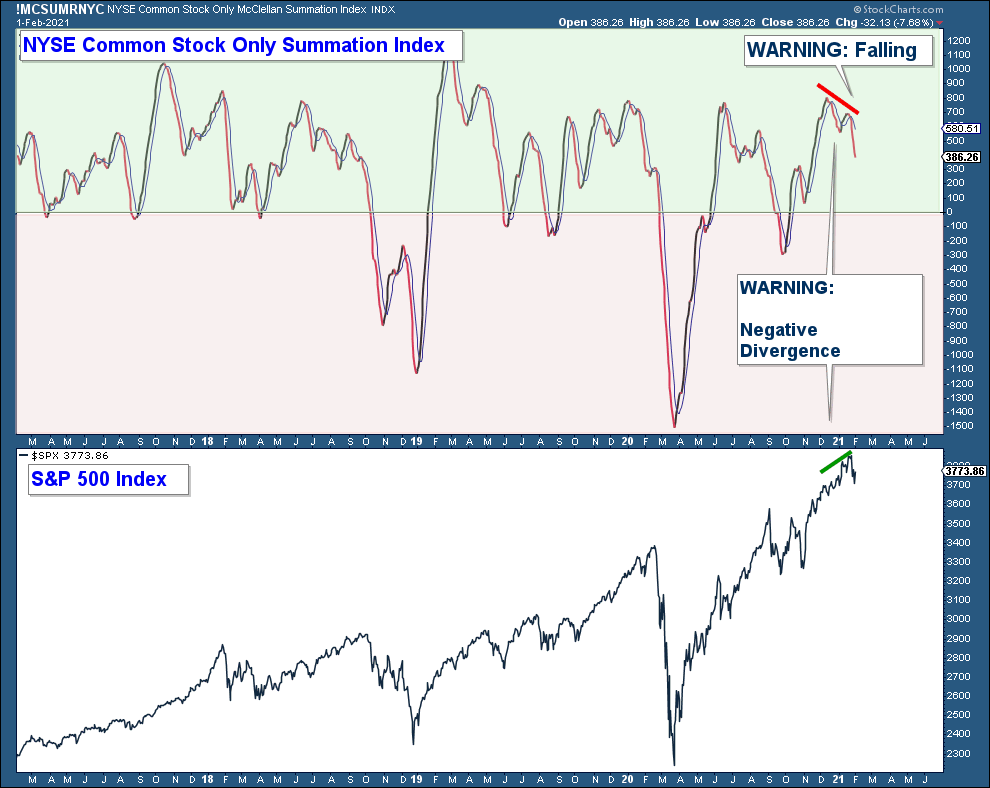
Below is a chart of the Summation Index, a breadth chart. There are two things that I look for on this chart. One, is the index below or above zero (area above zero is notated green and below is red). As a general rule, if the index is below zero market breadth is longer-term weak and caution is advised. And two, I look for moving average crossovers. When the index crosses below its 10-day moving average it suggests short-term breadth has turned negative and positive when it crosses up above this moving average.
Notice how the index crossed below its moving average and is falling but is above zero. This suggests that short-term breadth is negative but given it’s well above zero, longer-term breadth is still bullish. Also, note the negative divergence which is another short-term negative breadth warning.

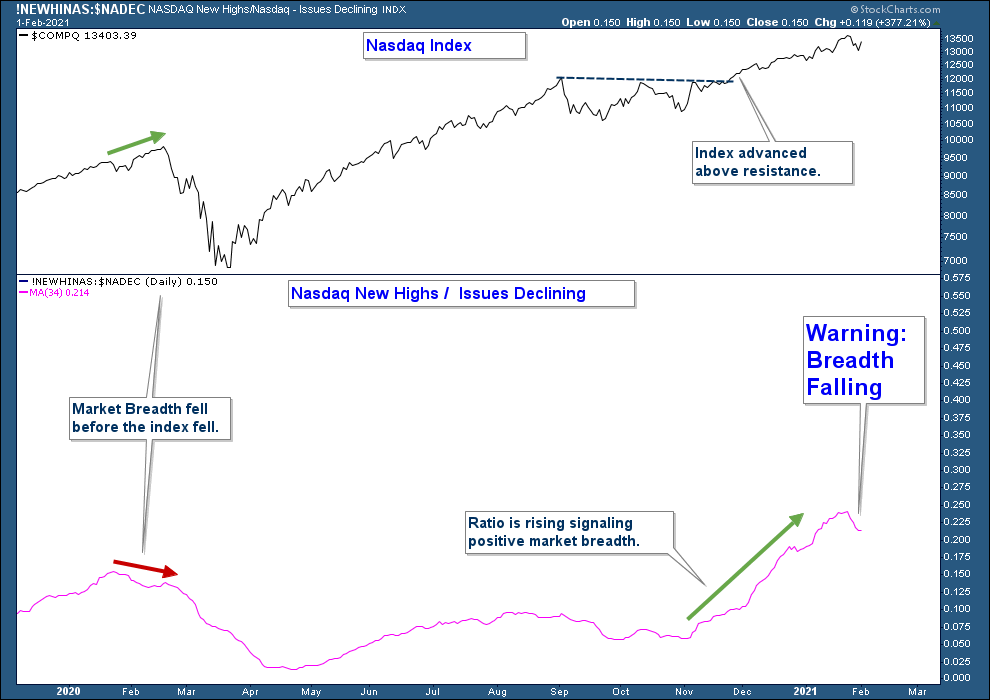
Another breadth chart that is flashing an early warning sign is the ratio of stocks within the Nasdaq hitting new 52-week highs versus those that are declining.
In the top panel is the NASDAQ Composite Index and in the lower panel is the ratio of Nasdaq stocks hitting new 52-week highs divided by the number of Nasdaq stocks declining. Because this ratio is volatile I have charted the 34-day moving average of this ratio (pink line).
If the number of stocks hitting new highs is greater than the number of stocks declining on average, this line will rise. Notice how this breadth indicator declined prior to the February 2020 market peak, signaling that from a breadth perspective, market conditions were weakening despite the market continuing to advance.
This ratio has recently started to fall which is yet another breadth indicator signaling a market losing internal strength.

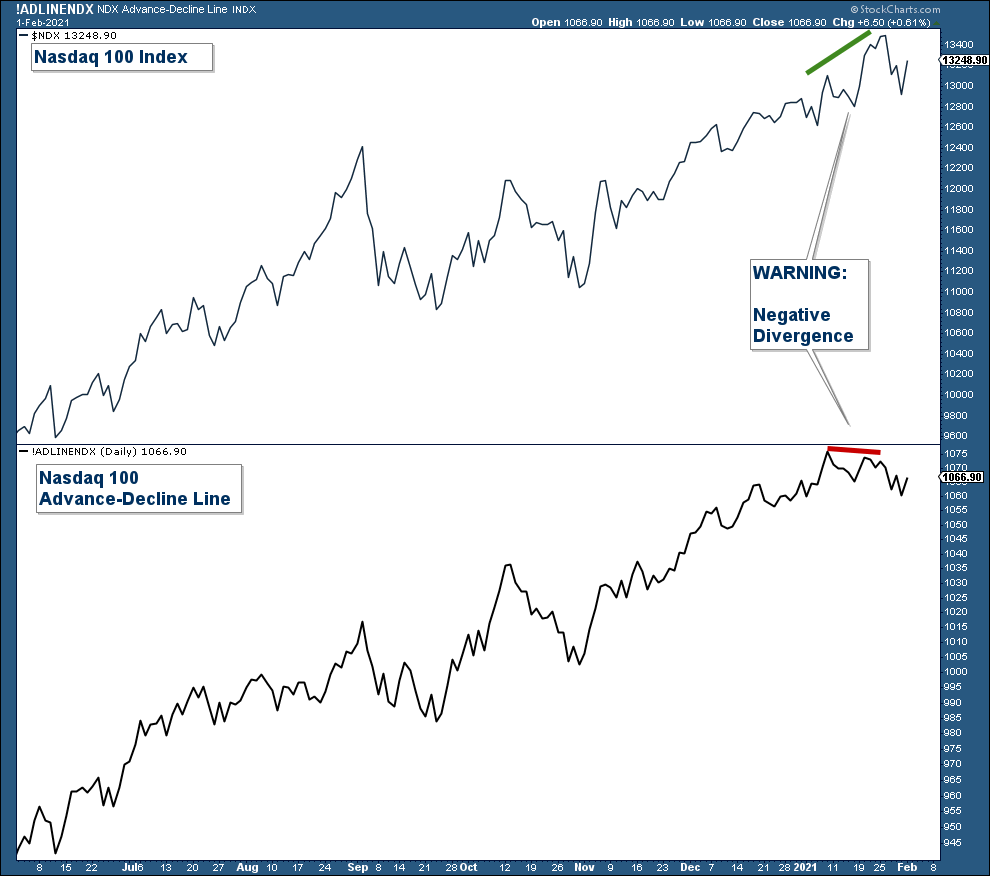
The Advance-Decline (AD) line is a popular breadth chart that looks at the number of advancing stocks versus declining stocks. Below is a chart of the AD line for the Nasdaq 100.
When the index hits a new high, but the AD line does not, it is called a negative divergence and signals waning market breadth.

Below is a chart of the VIX – Volatility Index, a sentiment indicator that is commonly referred to as a fear index. Instead of showing the daily VIX data points, I am charting the 20-day moving average to more easily detect the trend and inverted the index to make it easier to compare to the S&P 500. Also, I have shaded the chart green when the VIX has risen which is what you want to see when confirming a bullish market environment.
The VIX usually has an inverse relationship to the stock market. When that relationship breaks down, I have found that it can be an early warning signal that short-term market conditions may be on the cusp of changing. Keep in mind that the VIX chart below is inverted which makes the Index look to be positively correlated to the S&P 500.
Look at the left-hand side of the chart. Prior to the 33% drop in the S&P 500 at the beginning of last year, the VIX signaled a warning that market conditions may be deteriorating by diverging negatively with the S&P 500 index.
On the far right side of the chart, you can see that the VIX is again diverging with the S&P 500.

Long-term the stock market is in an uptrend. However, market internals suggests that short-term risk is rising given the continued deterioration in market sentiment and breadth.
Client Account Update
One way that I manage risk is by decreasing our equity exposure when market risk is high. If the odds are not in our favor, why would we want to place large bets with our market exposure?
Client accounts were fully invested going into the new year after a very bullish 2020 fourth quarter. Given what I view as elevated short-term risk, I sold all of our equity holdings progressively over the past month. All client accounts only hold bond funds.
Once market technicals improve, I will look to strategically add equity exposure.
If you have any questions, please feel free to send me an email.

Craig Thompson, ChFC
Email: [email protected]
Phone: 619-709-0066
Asset Solutions Advisory Services, Inc. is a Fee-Only Registered Investment Advisor specializing in helping the needs of retirees, those nearing retirement, and other investors with similar investment goals.
We are an “active” money manager that looks to generate steady long-term returns, while protecting clients from large losses during major market corrections.
Asset Solutions may discuss and display, charts, graphs, formulas which are not intended to be used by themselves to determine which securities to buy or sell, or when to buy or sell them. Such charts and graphs offer limited information and should not be used on their own to make investment decisions. Most data and charts are provided by www.stockcharts.com.
Asset Solutions is a registered investment adviser. Information presented is for educational purposes only and does not intend to make an offer or solicitation for the sale or purchase of any specific securities, investments, or investment strategies. Investments involve risk and unless otherwise stated, are not guaranteed. Be sure to first consult with a qualified financial adviser and/or tax professional before implementing any strategy discussed herein. Past performance is not indicative of future performance.
All charts provided by: StockCharts.com
