Stock Market
Breakout
In my August 4th update, Stock Market Weakness Likely, I pointed out that the market was likely to pullback, and as long as that weakness did not decisively violate the lower end of its uptrending channel, the market’s longer-term advance is still intact.
Below is a chart of the S&P 500 ETF (SPY) in the upper panel and the MACD (momentum indicator) in the lower panel. Here are my takeaways:
- The blue uptrending lines are a price channel that defines the market’s current uptrend.
- SPY advanced to the top of the channel at the end of July and its MACD (momentum) Indicator was at the top of its range. This suggested the odds were elevated that the market would pullback which is what occurred in August.
- The drop in stocks that occurred last month did not violate the channel and thus the longer-term uptrend is still intact.
- SPY advanced strongly last week and momentum turned positive.
As long as price continues to advance within this uptrending channel market conditions are positive from a price perspective. The August move to the middle/lower end of the channel combined with a positive move higher in momentum suggests that odds favor higher stock prices in the near term.

Risk-On Confirmation
A risk-on environment is a bullish sign for the market. The recent breakout that I highlighted in the chart above occurred concurrently with risk-on assets outperforming. This dynamic adds further confidence that investors will have the conviction necessary to bid up stocks in the near term.
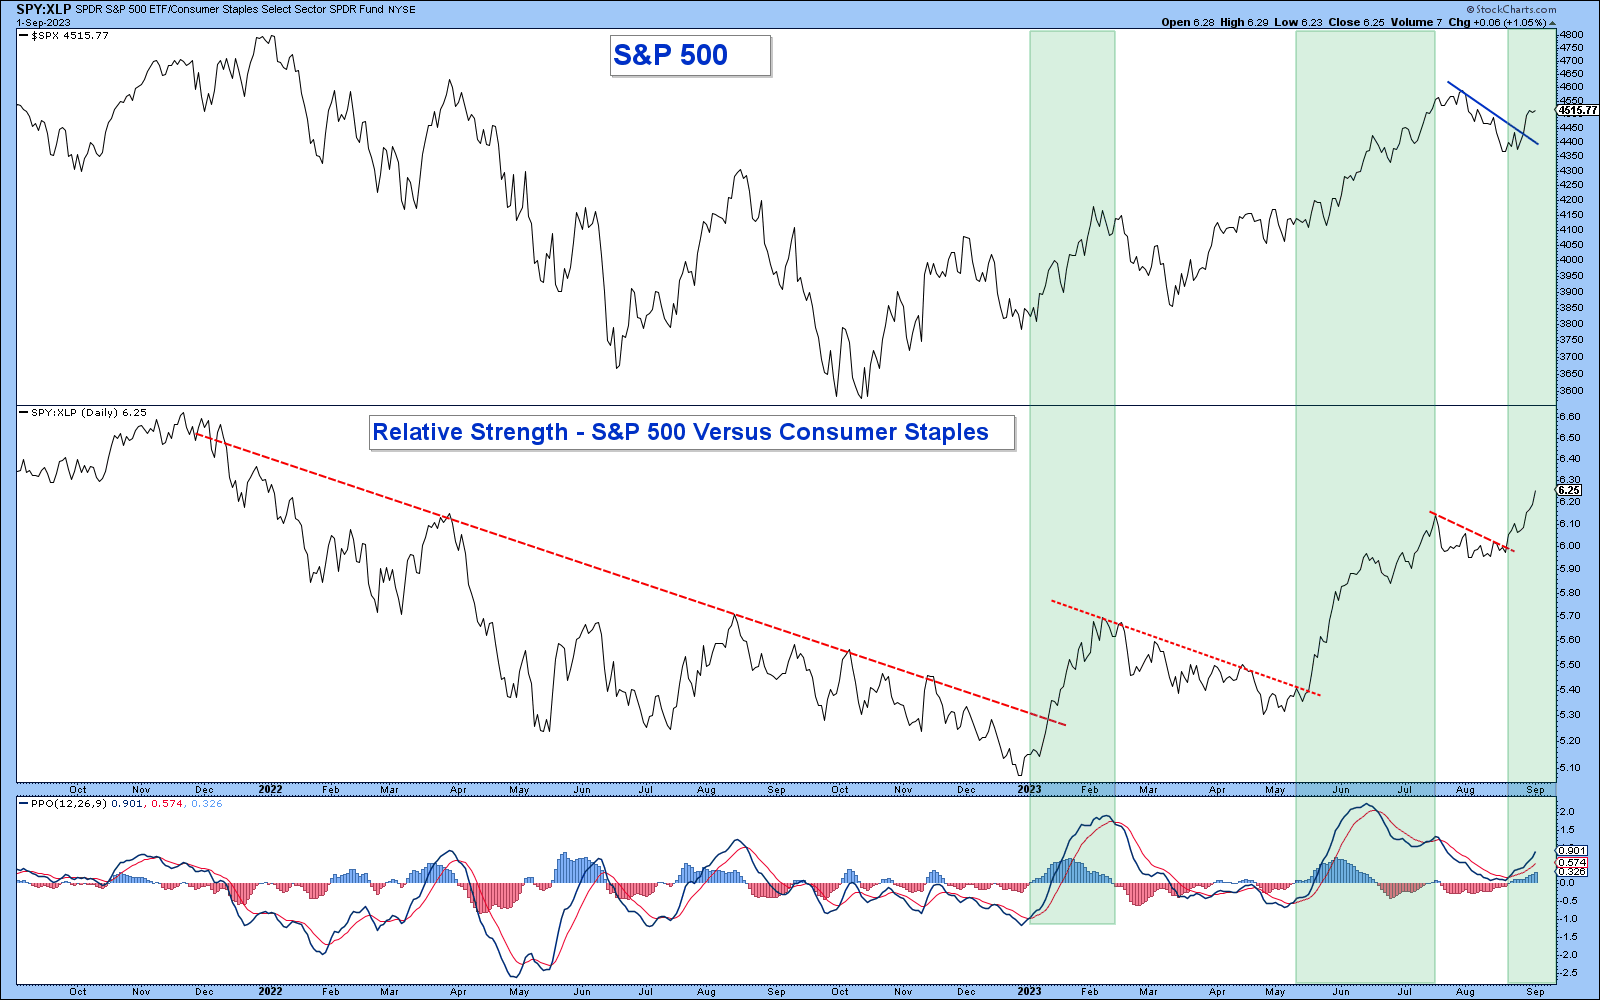
In the chart below is SPY in the upper panel and a relative strength chart in the middle panel. When the relative strength chart line rises it indicates that the S&P 500 is outperforming the Consumer Staples ETF (XLP) which is a risk-on dynamic.
Here are my takeaways from the chart below.
- Throughout last year’s market decline Consumer Staples consistently outperformed the market (risk-off) as indicated by a falling relative strength line (highlighted by the declining red line on the left side of the chart).
- At the beginning of this year, the line advanced strongly above the downtrend line that defined last year’s market correction indicating a risk-on environment.
- I have highlighted each rise in the relative strength line and it coincides with strength in the S&P 500 this year.
Last week’s S&P 500 breakout occurred as the relative strength line advanced strongly. This confirmed a risk-on environment as market momentum turned positive and added to my confidence that stocks can continue to rise in the near term.

Sector On The Move
Energy/Commodities
There is a material risk of recession that provides a cautionary backdrop to current stock market strength. If a recession materializes it will likely cause stocks to fall dramatically. Commodity-related assets tend to do well during periods of late economic expansion and early recessions. This dynamic combined with current outperformance makes these stocks attractive.
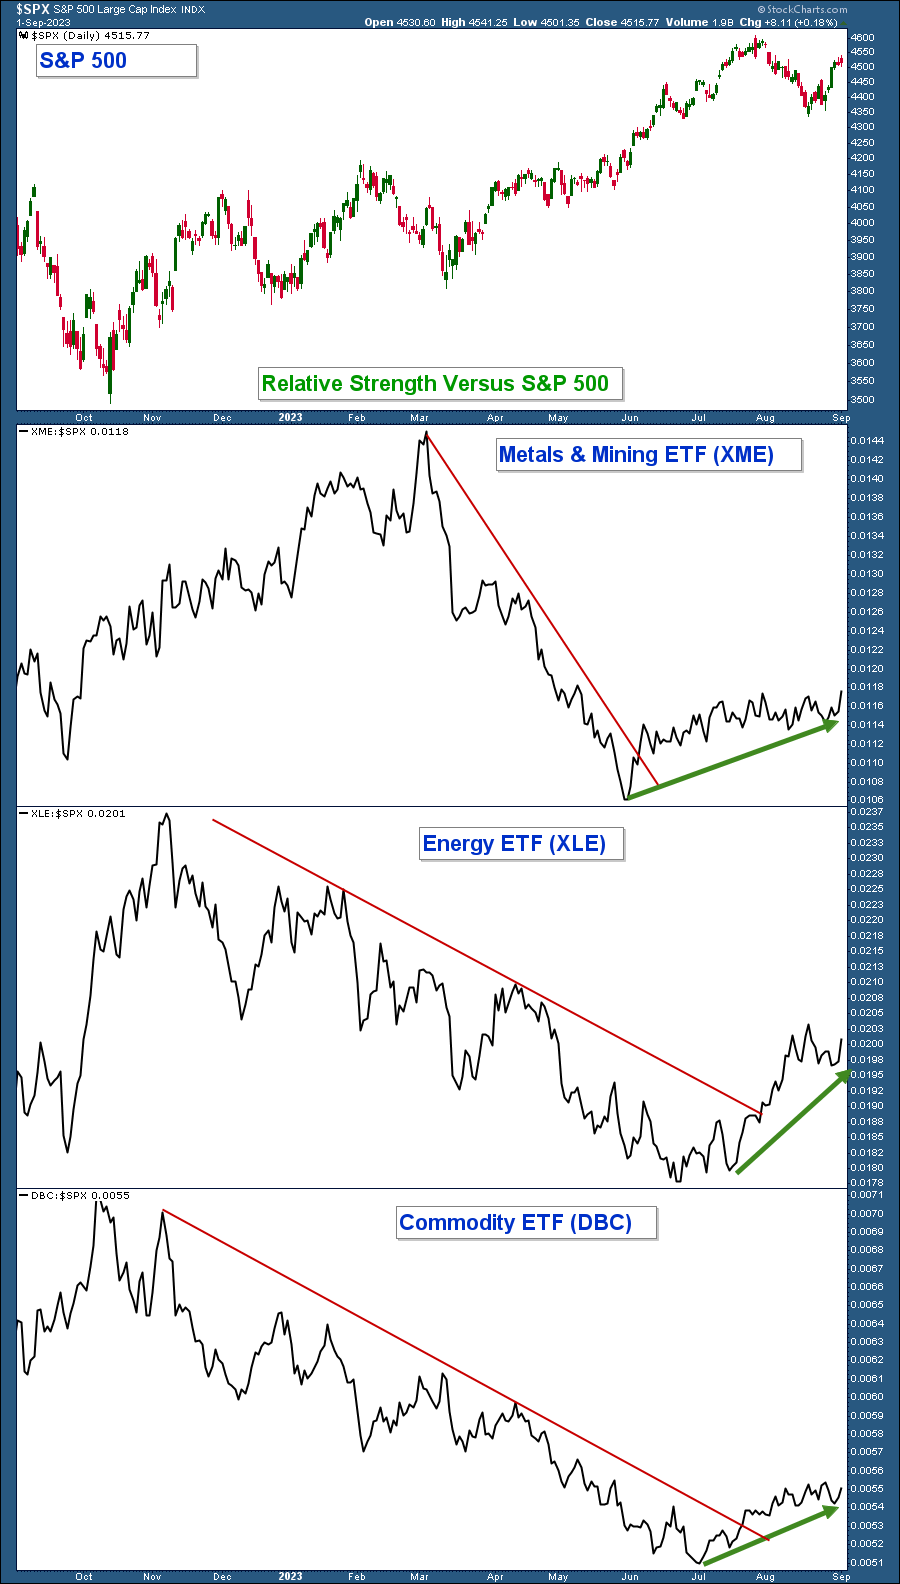
Below is a chart of the S&P 500 in the top panel and relative strength charts for three commodity-related ETF’s below. When their relative strength lines fall it indicates they are underperforming the index and when they rise it means they are outperforming.
All three relative strength charts depict underperformance highlighted with a declining red trendline. Notice how each of them broke above their downtrend lines and have been outperforming as highlighted with green arrows.
Commodity-related stocks have begun to outperform.
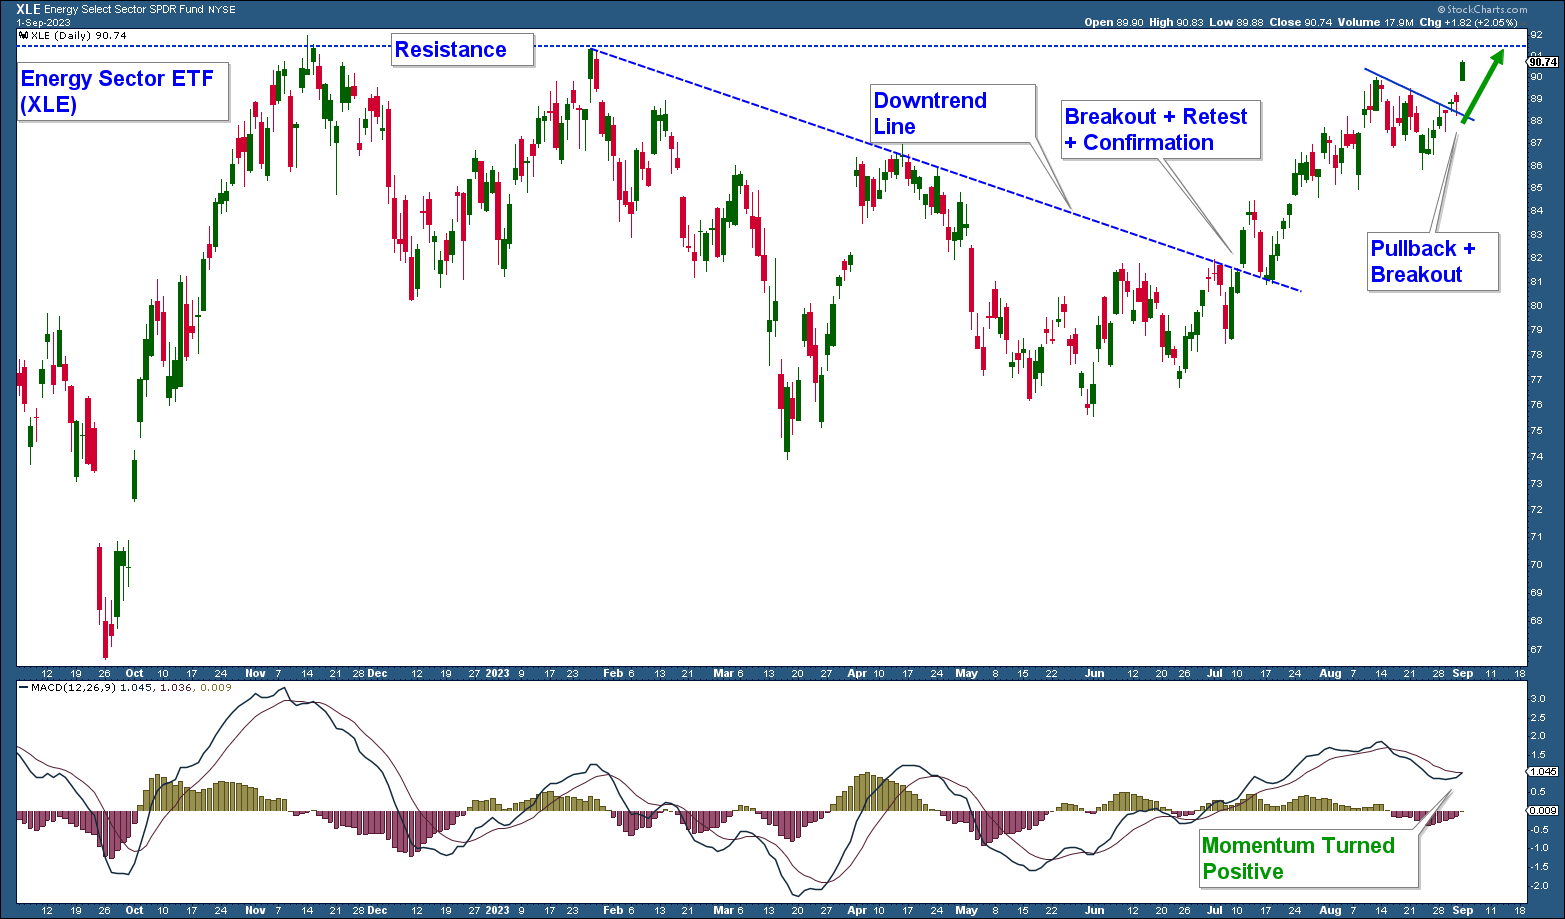
Below is a chart of the Energy Sector ETF (XLE). Energy had been trending lower after making a double top at the beginning of the year. It broke above the downtrend line (blue line) that defined that move lower and has continued to advance higher on strong relative strength.
XLE is near those earlier highs so we could get some type of hesitation at that level; however, I would expect XLE to eventually break above that area of resistance given strong underlying technicals.

Client Account Update
The shorts I added at the beginning of last month sheltered client accounts from August’s market weakness. I sold all of those shorts as short-term momentum turned positive last week.
- Our Conservative Model is nearly fully invested.
- Our Aggressive Model is about 65% invested. I intend to add equity positions on weakness as long as market technicals remain positive.
CAN WE HELP YOU?
HERE’S AN EASY WAY TO FIND OUT:
We want clients who are a good mutual fit. To find out, we offer a no-pressure complimentary consultation. If we can help you and you want to work with us, that’s great. But if you don’t, we will give you free asset allocation direction on your retirement accounts, at no charge and with no strings attached.
If you are interested, send us an email to set up your complimentary zoom meeting.

Craig Thompson, ChFC
Email: [email protected]
Phone: 619-709-0066
Asset Solutions Advisory Services, Inc. is a Fee-Only Registered Investment Advisor specializing in helping the needs of retirees, those nearing retirement, and other investors with similar investment goals.
We are an “active” money manager that looks to generate steady long-term returns, while protecting clients from large losses during major market corrections.
Asset Solutions may discuss and display, charts, graphs, formulas which are not intended to be used by themselves to determine which securities to buy or sell, or when to buy or sell them. Such charts and graphs offer limited information and should not be used on their own to make investment decisions. Most data and charts are provided by www.stockcharts.com.
Asset Solutions is a registered investment adviser. Information presented is for educational purposes only and does not intend to make an offer or solicitation for the sale or purchase of any specific securities, investments, or investment strategies. Investments involve risk and unless otherwise stated, are not guaranteed. Be sure to first consult with a qualified financial adviser and/or tax professional before implementing any strategy discussed herein. Past performance is not indicative of future performance.


