Stock Market
As mentioned in our August 7th newsletter, Stock Market Weakness Likely, the market reached overbought levels and was due for a pullback. Below is the same chart that I presented in that update.
I stated that the market was advancing within an uptrending channel (blue parallel lines) and a pullback to the lower of that channel, if met with heaving buying, would be bullish, meaning the uptrend was still valid.
On the other hand, a move decisively violating the lower line of the channel would be bearish and suggest a change in trend, which means the market would then be in a downtrend.
The latter occurred. Here are my takeaways from the chart below.
- The uptrending channel annotated with blue lines has been violated to the downside. This signals a likely change in trend.
- The current downtrend is defined by the orange downward-sloping lines.
- The index has advanced above its 200-day moving average and is sitting at major resistance.
- The index fell decisively below its trendline then advanced back to that trendline. This pattern is common and typically resolves to the downside.
What I am watching.
- Bullish Scenario – If we are going to get an end-of-year market rally, the market needs to advance strongly above resistance.
- Bearish Scenario – If the index fails to advance above resistance, that would be bearish and further reinforce the market’s current decline.

Market Breadth
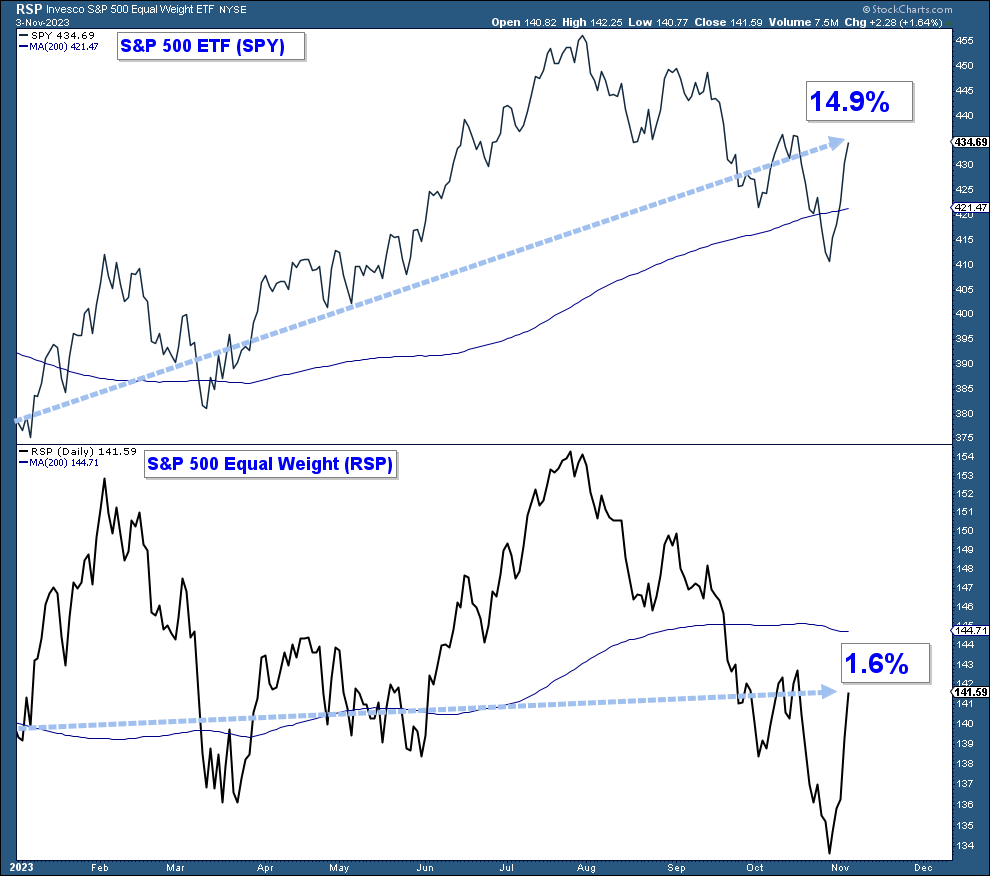
Market breadth has primarily been negative. A handful of mega-cap stocks have skewed the performance of the major indexes to the upside. Most major market indexes are cap-weighted and the mega-cap stocks within those indexes have an outsized weighting on their performance.
Below is a chart of an S&P 500 ETF in the upper panel and an equally weighted S&P 500 ETF in the lower panel. While the S&P 500 is up 14.9% year-to-date the equally weighted index is only up 1.6%
Conclusion: Market breadth is negative.

Risk-On vs Risk-Off
During bullish market environments, investors will bid up prices for riskier stocks. The market is at an inflection point and risk sentiment can give us a clue to the market’s next move.
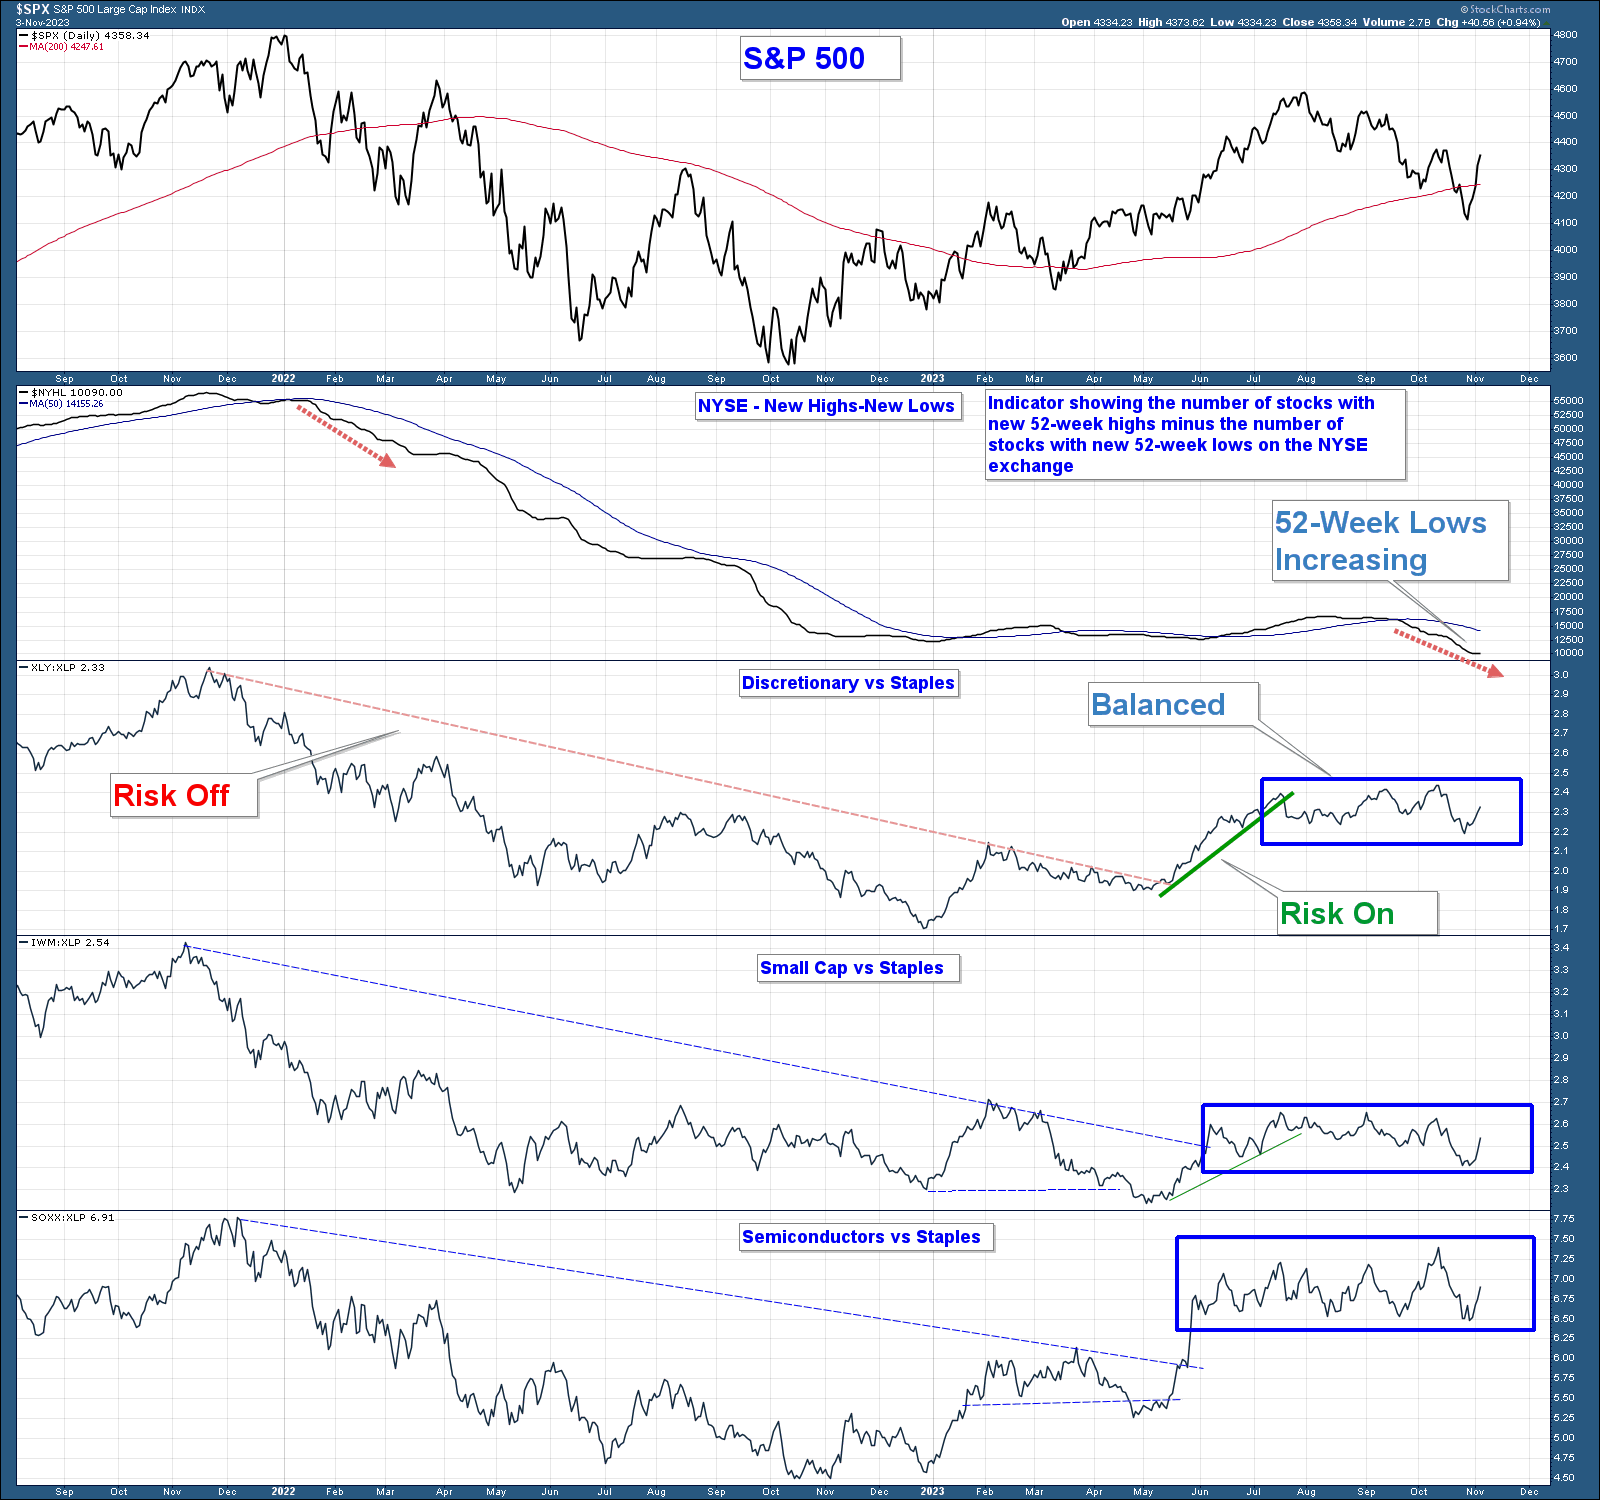
In the chart below, is the S&P 500 in the upper panel. Below the index, we have the following charts.
- NYSE – New Highs Minus New Lows: This breadth indicator charts the number of stocks hitting new 52-week highs minus those reaching new 52-week lows on a cumulative basis.
- 3 Relative Strength Charts: These charts compare the performance of Consumer Discretionary, Small Cap, and Semiconductor stocks, all considered risk-on indexes to Consumer Staples a risk-off sector. When the line falls it indicates that the risk-on asset is underperforming and when it rises those risk-on indexes are outperforming.
Here are my takeaways from the chart.
- NYSE – New Highs Minus New Lows: Notice how the line has fallen decisively below its 50-day moving average. New lows are starting to overwhelm new highs. This suggests market breadth is negative or bearish.
- 3 Relative Strength Charts: All three charts are trending sideways indicating the market has reached a level of risk equilibrium. A move above this area of consolidation would be bullish and below would be bearish.
Summary: Market breadth is bearish and risk assets are neither outperforming nor underperforming.

Commodity Outperformance Continues
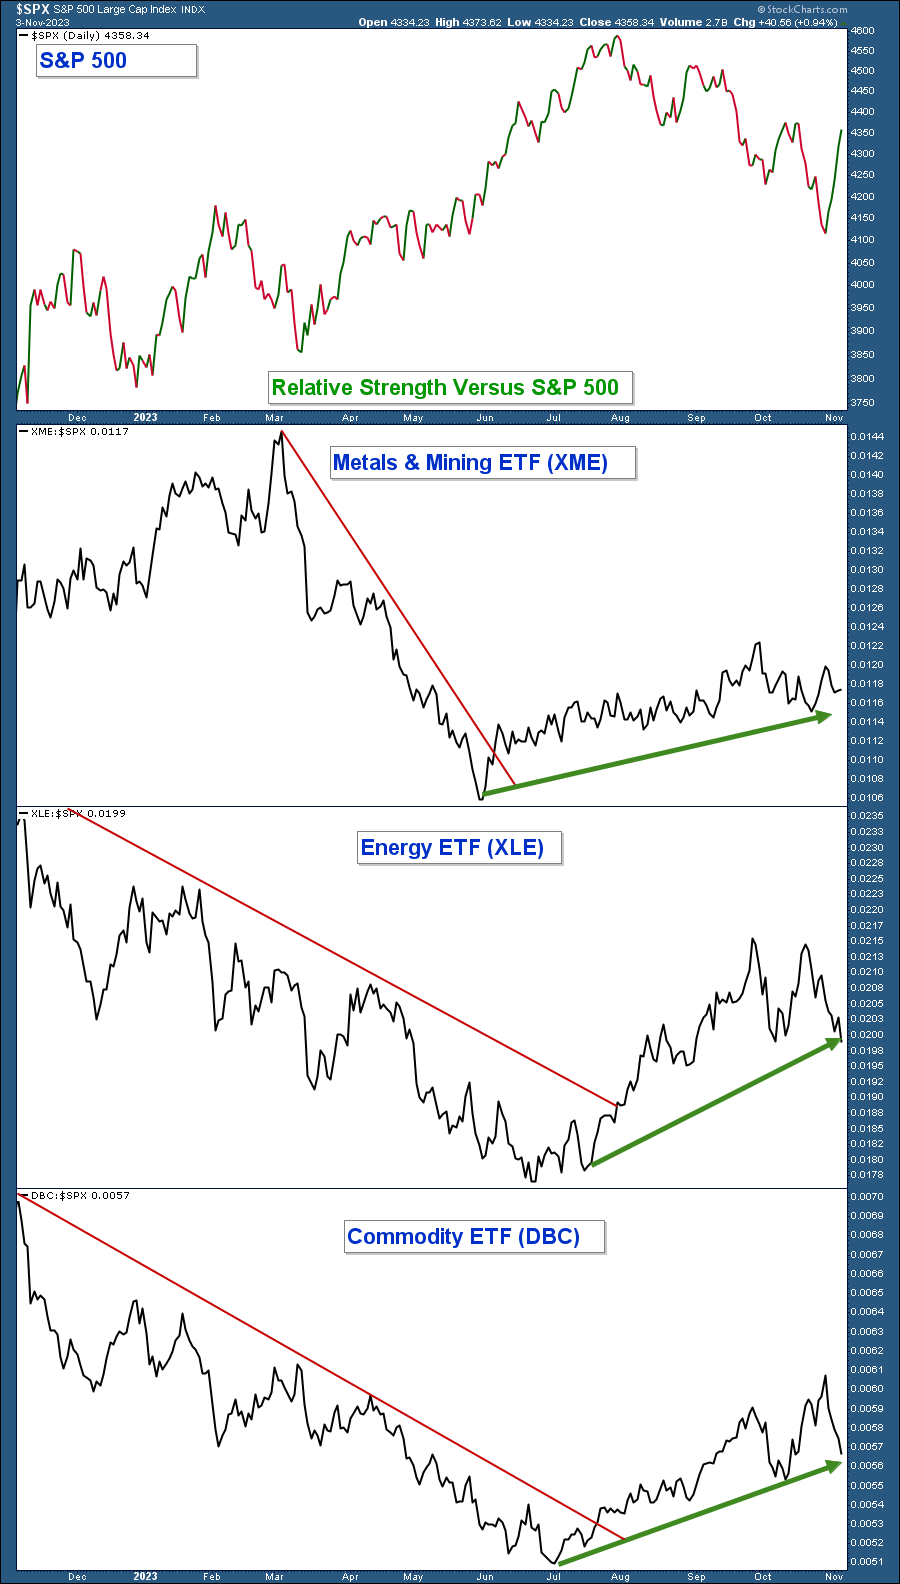
Commodity-related stocks have continued to perform well on a relative basis.
Below is a relative strength chart of three commodity-related sectors/industry groups versus the S&P 500. In the upper panel is a chart of the S&P 500 and in the lower panels are the relative strength charts.
All three have been outperforming the index since June 2023.
Conclusion: Commodity-related stocks continue to outperform the broader stock market.
Summary
The market is at an inflection point. A move higher from here would be bullish if occurring in conjunction with improved market breadth and outperformance by risk-on assets.
On the other hand, if the market is not able to advance above resistance and declines then the market is still in a downtrend and the broader market environment would continue to be bearish in the near term.
Given the majority of the underlying technical evidence is bearish, I believe the odds favor a market decline from here; however, I will keep an open mind and use market data to determine my market thesis.
Client Account Update
Client accounts have been invested defensively for the past three months and have done well despite the three-month market correction.
Currently, most accounts have equity exposure set at reduced levels and those positions are hedged with index short funds. I monitor and recalibrate our short exposure based on daily market analysis. This allocation does not apply to new client accounts.
New accounts are invested primarily in a high-yielding money market fund.
If the market breaks down from here I will maintain our current defensive strategy of being long strong stocks and short the market, as long as we continue to be rewarded for the risk that we are taking. On the other hand, if technicals turn positive I will sell our short positions and progressively add to our long positions.
We continue to have an oversized allocation in energy and commodity-related stocks.
CAN WE HELP YOU?
HERE’S AN EASY WAY TO FIND OUT:
We want clients who are a good mutual fit. To find out, we offer a no-pressure complimentary consultation. If we can help you and you want to work with us, that’s great. But if you don’t, we will give you free asset allocation direction on your retirement accounts, at no charge and with no strings attached.
If you are interested, send us an email to set up your complimentary zoom meeting.

Craig Thompson, ChFC
Email: [email protected]
Phone: 619-709-0066
Asset Solutions Advisory Services, Inc. is a Fee-Only Registered Investment Advisor specializing in helping the needs of retirees, those nearing retirement, and other investors with similar investment goals.
We are an “active” money manager that looks to generate steady long-term returns, while protecting clients from large losses during major market corrections.
Asset Solutions may discuss and display, charts, graphs, formulas which are not intended to be used by themselves to determine which securities to buy or sell, or when to buy or sell them. Such charts and graphs offer limited information and should not be used on their own to make investment decisions. Most data and charts are provided by www.stockcharts.com.
Asset Solutions is a registered investment adviser. Information presented is for educational purposes only and does not intend to make an offer or solicitation for the sale or purchase of any specific securities, investments, or investment strategies. Investments involve risk and unless otherwise stated, are not guaranteed. Be sure to first consult with a qualified financial adviser and/or tax professional before implementing any strategy discussed herein. Past performance is not indicative of future performance.


