The S&P 500
The stock market has continued to build on last month’s positive technical improvements. Below is a chart of the S&P 500 Index and here are my takeaways.
- The index has advanced above its downtrend line (red line).
- The index is in a structural uptrend that began with the October 2022 low.
- The up-trending price action is contained within the notated price channel (blue lines).
- The index is above its 200-day moving average.
- The index has recently advanced strongly above two more important resistance areas (red-shaded lines).
Conclusion: The stock market is continuing to build positive technical momentum. As long as the S&P 500 continues to trade above its 200-day moving average and does not fall decisively below the lower end of its up-trending channel, the market is bullish from a price perspective.

Risk-On vs Risk-Off
A strong stock market is often characterized by a risk-on environment, where investors tend to favor stock categories that offer higher potential returns, despite the accompanying downside risks.
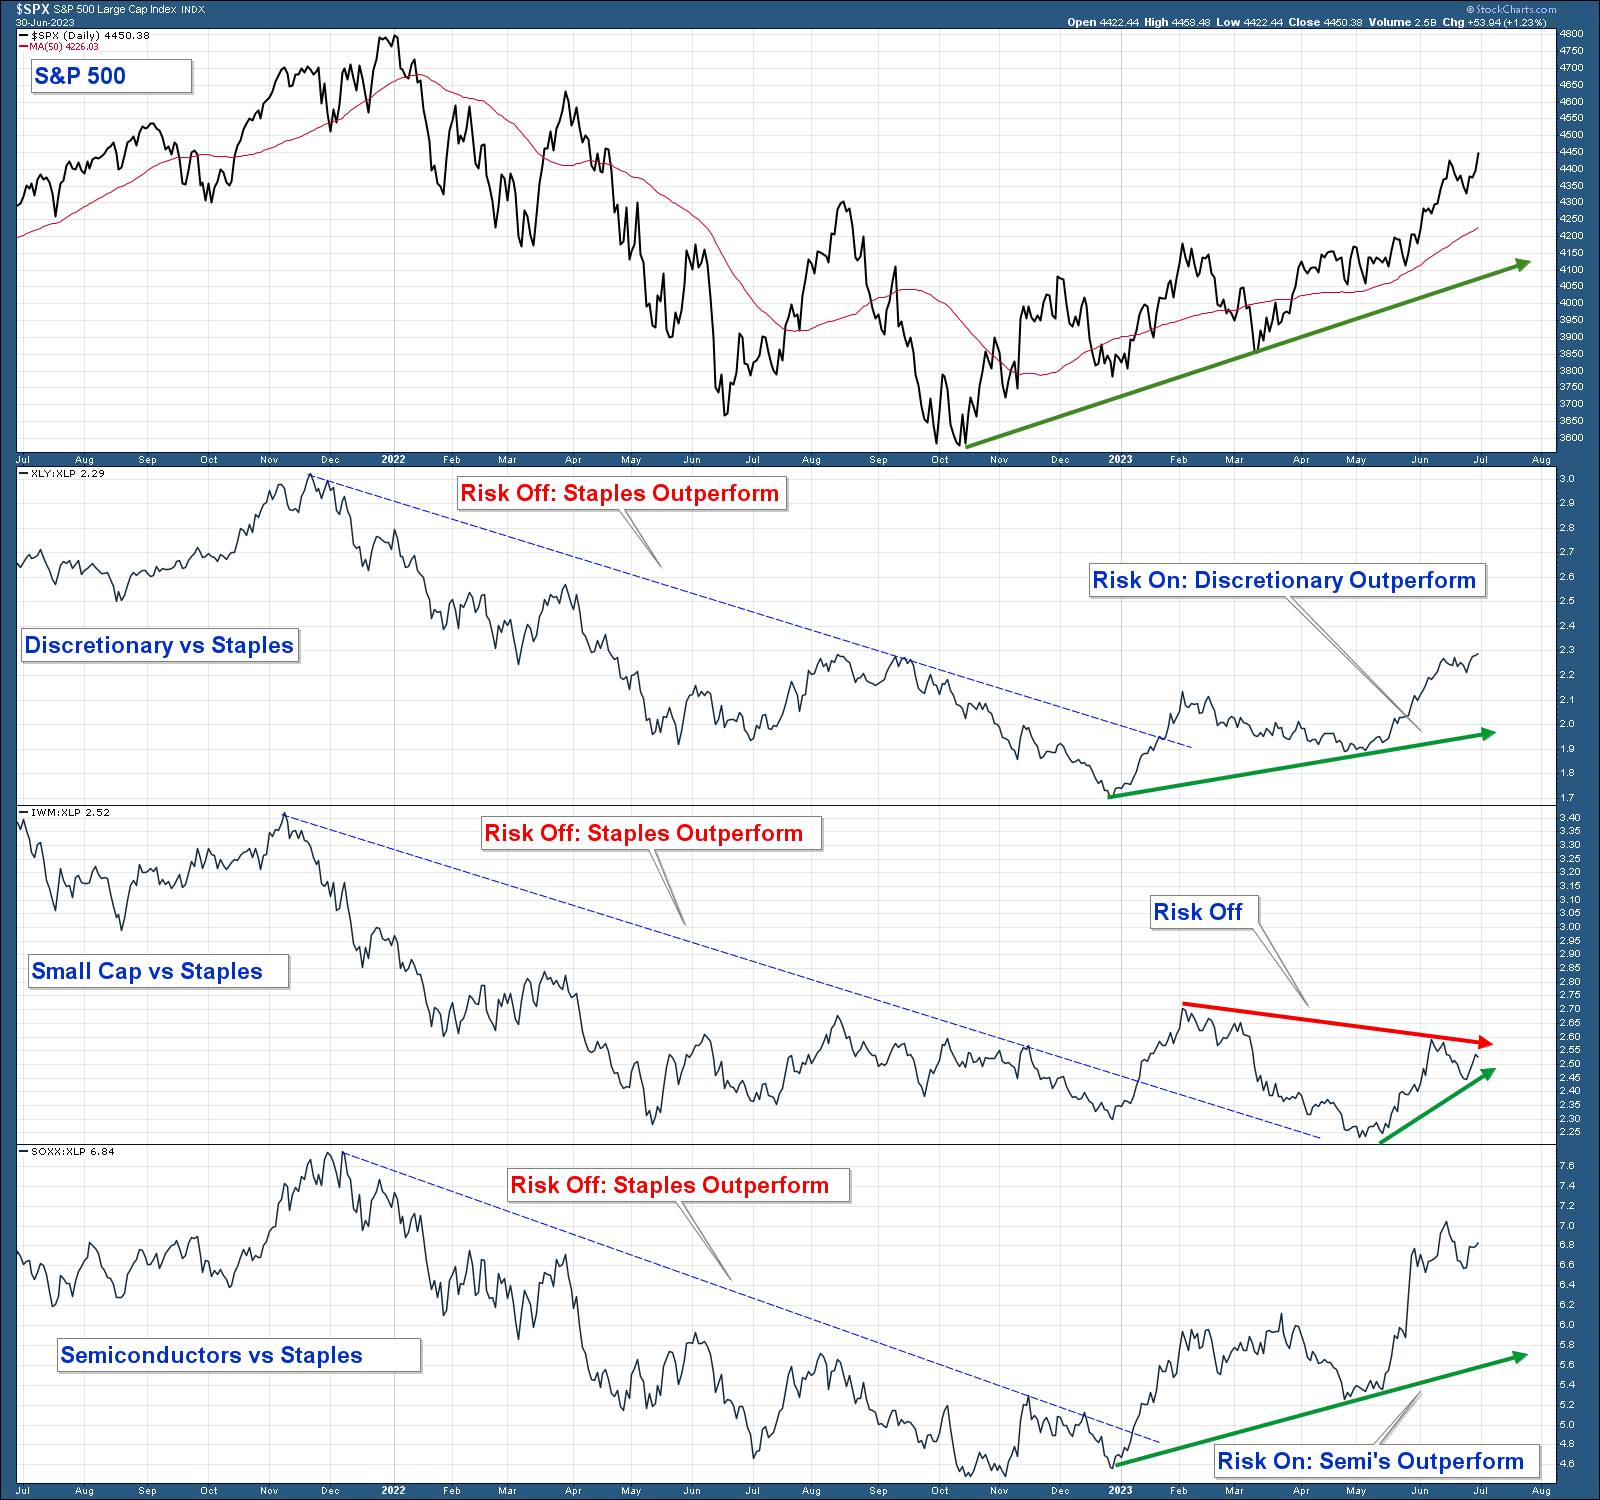
In the chart below, I have plotted the relative strength of three risk-on funds compared to the Consumer Staples ETF (XLP) which is a risk-off sector. Here are the key takeaways:
- When the risk-on group is outperforming, the line is rising, and when it is falling it indicates that the risk-off Consumer Staples sector is outperforming.
- The market was in a decidedly risk-off environment throughout last year’s market correction.
- Risk-on assets started to outperform in January of 2023.
- Consumer Discretionary and Semiconductor stock indexes continue to outperform.
- Small Cap stocks started to outperform two months ago but are still far below their February peak.
Conclusion: The fact that risk-on assets are outperforming as the stock market advances above resistance is a bullish sign. It suggests that market participants embrace higher-risk investments, indicating a positive outlook for the stock market.
While small-cap stock’s relative performance has improved over the last couple of months, it is still underperforming over the longer term. If small caps outperform in the coming months it would be bullish for the overall market. This is something that we will be watching closely.

Small-Cap Stocks
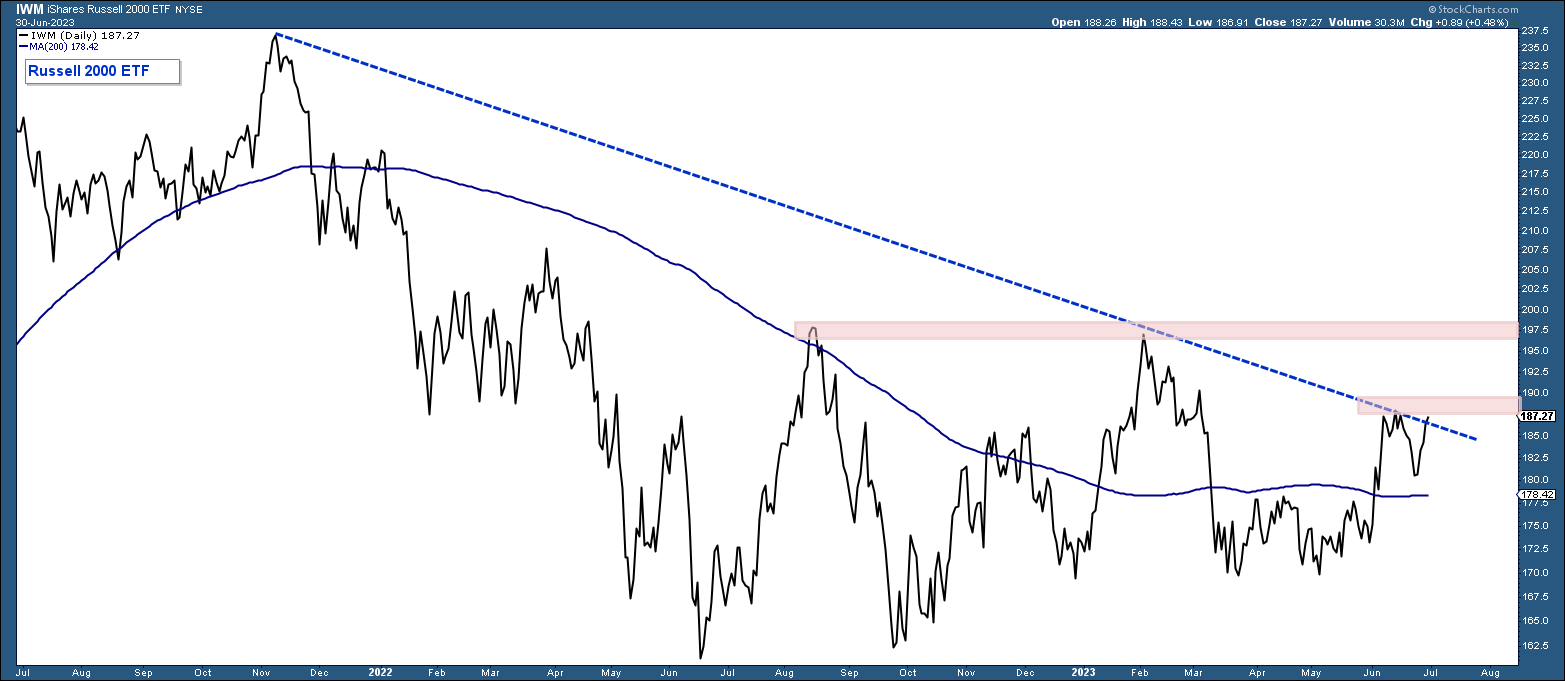
Small-cap stocks have underperformed since March 2021. That 2021 underperformance was one of the negative technical factors that warned of the market correction that followed in 2022.
The Russell 2000 is now at an inflection point sitting right at its downtrend line and under a couple of areas of resistance. Sector rotation is the lifeblood of a strong market; therefore, if we see money move into this asset class it would have bullish broad market implications.

Market Breadth
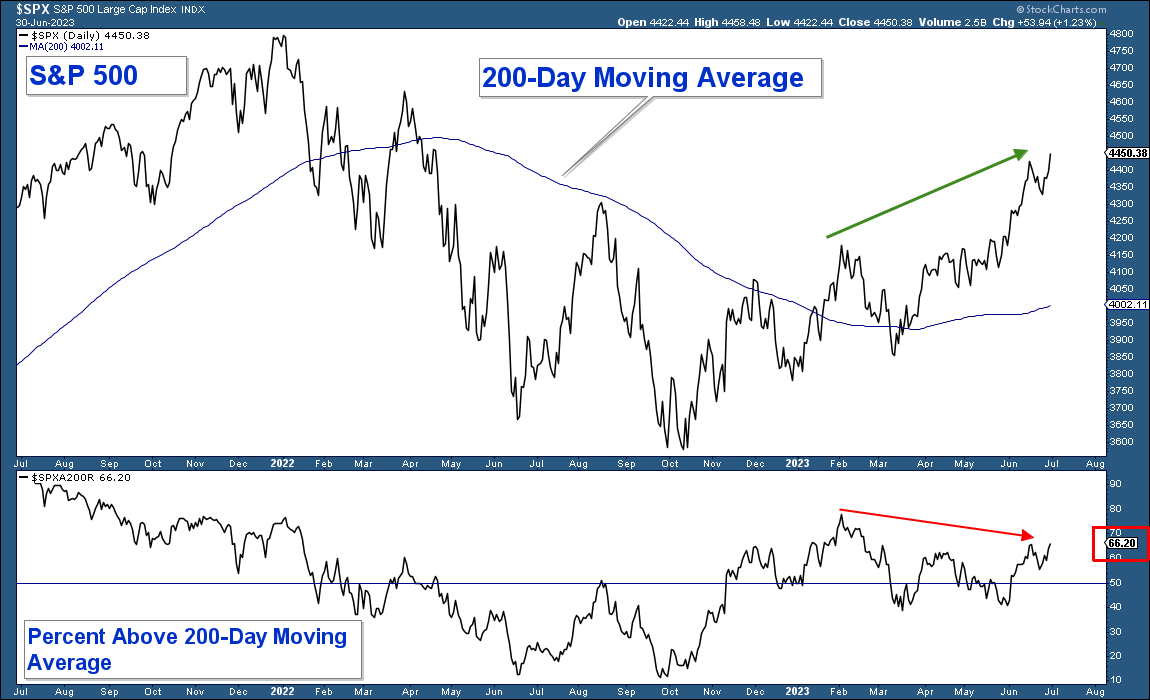
Market breadth has improved slightly but the mega-cap stocks are still doing most of the heavy lifting associated with this year’s market advance. Below is the same chart that I showed last month.
In the top panel is a chart of the S&P 500 Index, and in the lower panel is a chart that tracks the number of stocks within that index that are above their respective 200-day moving averages. Here are my takeaways.
- The S&P 500 has advanced substantially above its 200-day moving average.
- However, only 66% of stocks within that index are above their respective moving averages. This is higher than last month (53%) but still below its February high (red arrow).
Conclusion: Market breadth has improved but is still somewhat weak.

Conclusion
Overall the market looks bullish from a technical perspective. Yes, there is the issue of narrow leadership but that can get resolved with time. The thing to watch in the coming weeks is for signs of sector rotation which would suggest that this market has more room to run.
The biggest risk to the bullish scenario that market technicals are sending is a recession. Most notable macroeconomists that I follow believe a recession is coming even though it may be a little later than originally predicted. If economic data starts to confirm these recession calls, the market will experience a significant decline.
To use a weather analogy, market technicals are predicting sunny skies with a chance of ominous thunderstorms.
Client Account Update
Given that market technicals have improved, I have gradually added equity exposure.
CAN WE HELP YOU?
HERE’S AN EASY WAY TO FIND OUT:
We want clients who are a good mutual fit. To find out, we offer a no-pressure complimentary consultation. If we can help you and you want to work with us, that’s great. But if you don’t, we will give you free asset allocation direction on your retirement accounts, at no charge and with no strings attached.
If you are interested, send us an email to set up your complimentary zoom meeting.

Craig Thompson, ChFC
Email: [email protected]
Phone: 619-709-0066
Asset Solutions Advisory Services, Inc. is a Fee-Only Registered Investment Advisor specializing in helping the needs of retirees, those nearing retirement, and other investors with similar investment goals.
We are an “active” money manager that looks to generate steady long-term returns, while protecting clients from large losses during major market corrections.
Asset Solutions may discuss and display, charts, graphs, formulas which are not intended to be used by themselves to determine which securities to buy or sell, or when to buy or sell them. Such charts and graphs offer limited information and should not be used on their own to make investment decisions. Most data and charts are provided by www.stockcharts.com.
Asset Solutions is a registered investment adviser. Information presented is for educational purposes only and does not intend to make an offer or solicitation for the sale or purchase of any specific securities, investments, or investment strategies. Investments involve risk and unless otherwise stated, are not guaranteed. Be sure to first consult with a qualified financial adviser and/or tax professional before implementing any strategy discussed herein. Past performance is not indicative of future performance.

