Major Data Points – February 2024
- The stock market is in a strong bullish environment.
- Short-term the market is extended and nearing the upper end of its uptrending channel which is an area where it has pulled back in the past.
- Market breadth has deteriorated over the past month which is an additional factor that suggests we could see a minor short-term correction in stocks in the near term.
Stock Market
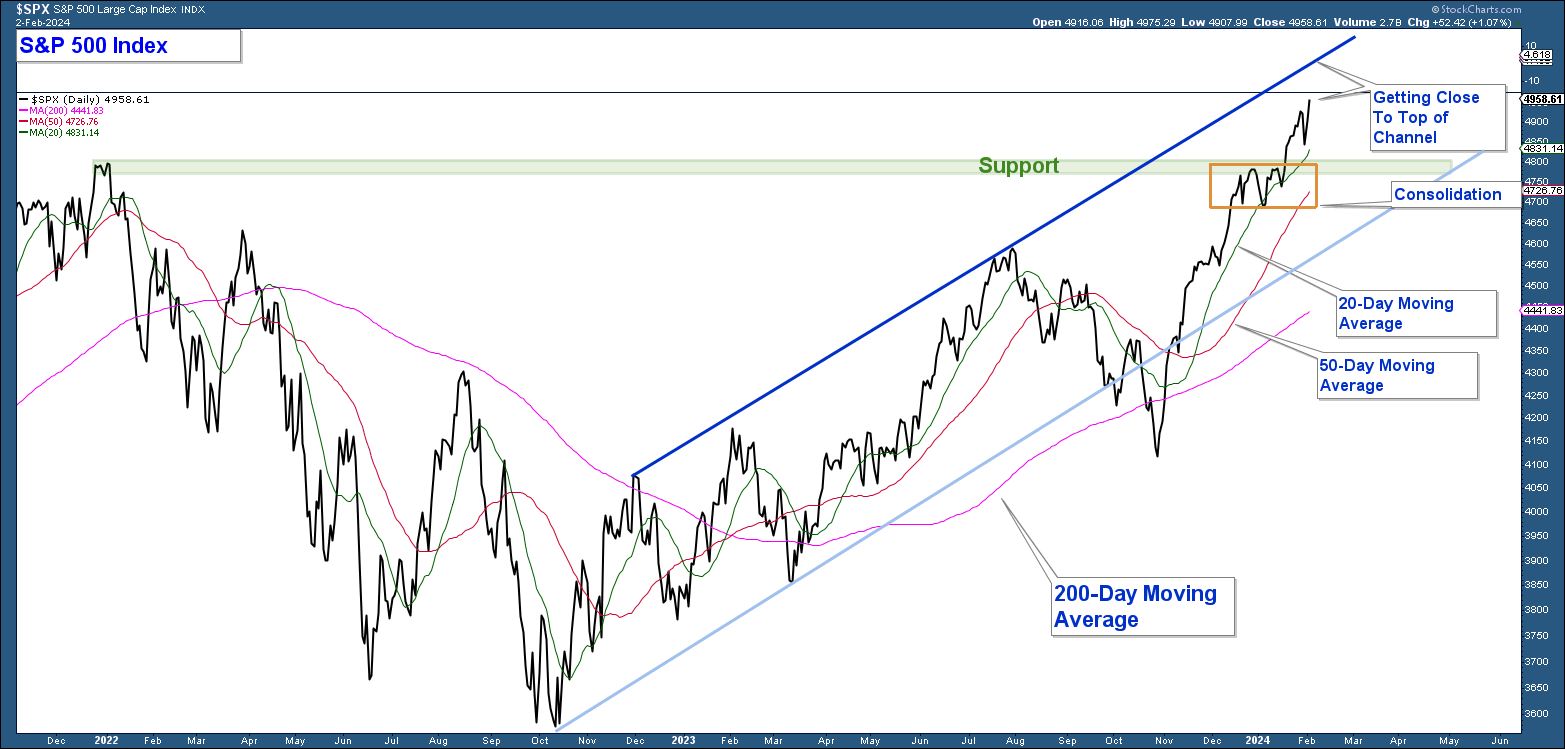
In last month’s newsletter, Breadth Thrust, I wrote about how the market experienced a breadth thrust that historically has proceeded strong longer-term returns for stocks. However, at the time the S&P 500 was extended and at resistance (orange rectangle in the chart below) which suggested the odds of a short-term pullback were elevated. The weakness that occurred was more minor than what I expected which is a bullish sign. The index has continued to advance higher and while strong is extended.
Below is a daily chart of the S&P 500 Index and here are my takeaways.
- The index is rising within an up-trending channel defined by two ascending parallel lines.
- The pullback (orange rectangle) at resistance (now support) was minor which is a sign of market strength.
- The index has continued to advance above its 20-day moving average which is bullish price action given this is a short-term moving average.
- All three moving averages (20,50,200) are trending higher which indicates the trend of the market is up.
The index is nearing the top of the channel which is an area where the index has pulled back in the past. Any weakness that might occur in the coming weeks is assumed to be minor and not a change in the longer-term market uptrend.

Market Breadth
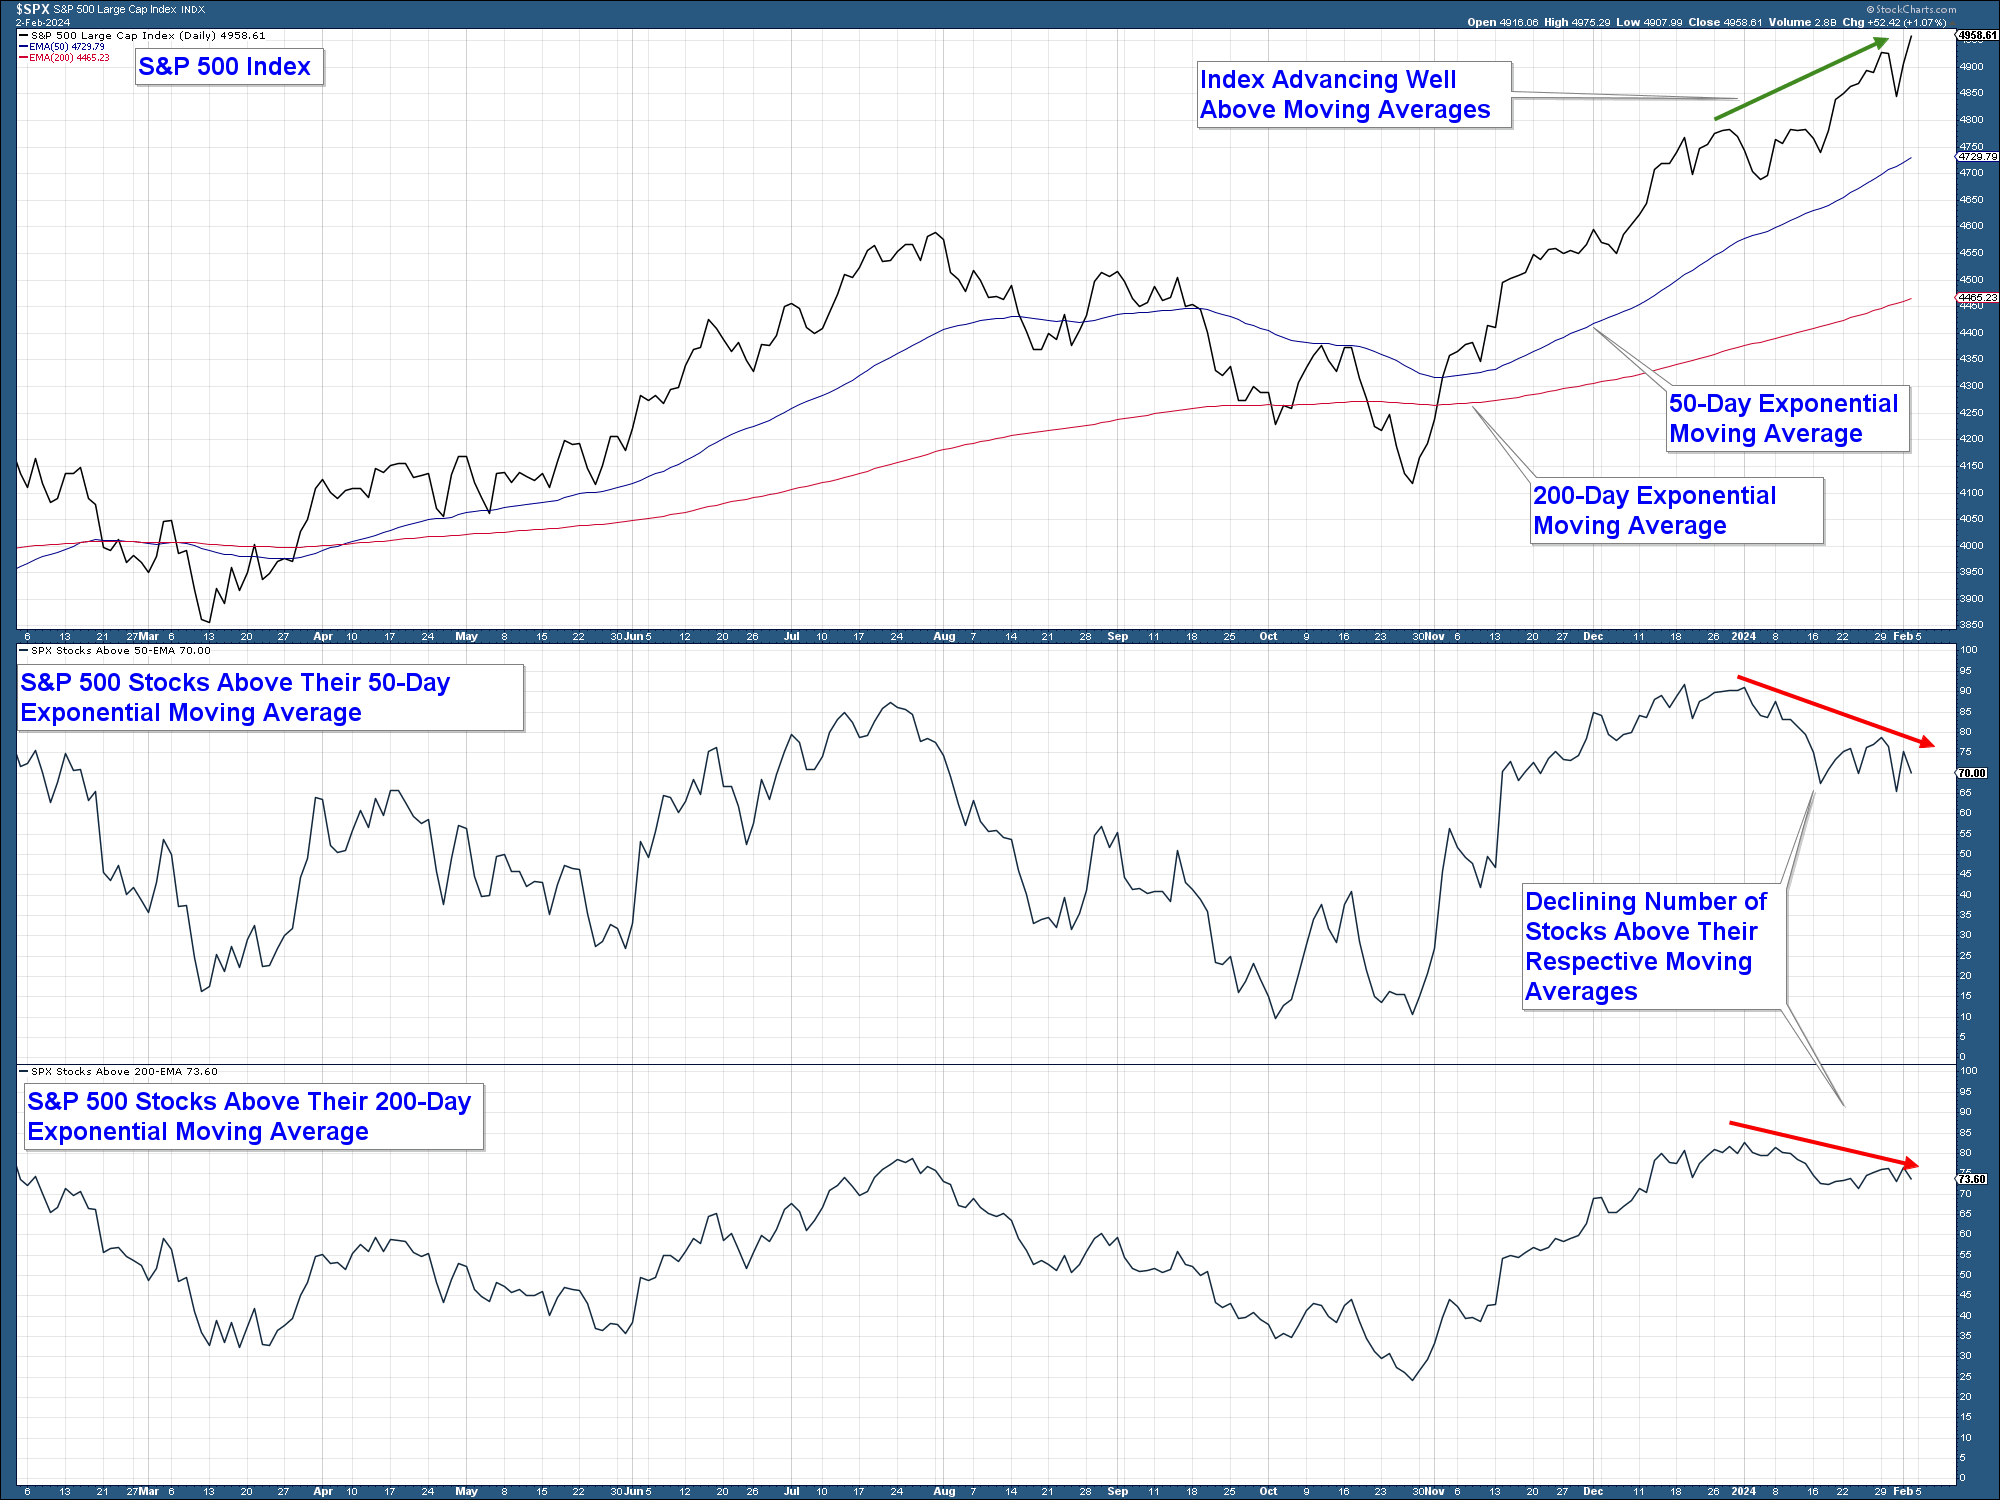
While the market has advanced strongly over the past few months, we are starting to see market breadth deterioration. Meaning that the number of stocks participating in the advance is declining. This suggests that the odds of a short-term pullback in the market are beginning to increase.
In the chart below is the S&P 500 Index in the upper panel with its 50 and 200-day exponential moving averages. In the middle panel is a chart of the percent of stocks within that index above their respective 50-day exponential moving averages. And in the lower panel the percent above their 200-day exponential moving averages.
Here are my takeaways.
- In the upper panel, the S&P 500 is well above both moving averages.
- In the middle panel, the number of stocks above their respective 50-day exponential moving averages has been declining for the past four weeks.
In the lower panel, you have a similar decline in the number of stocks above their 200-day exponential moving average.

Long-Term Market View
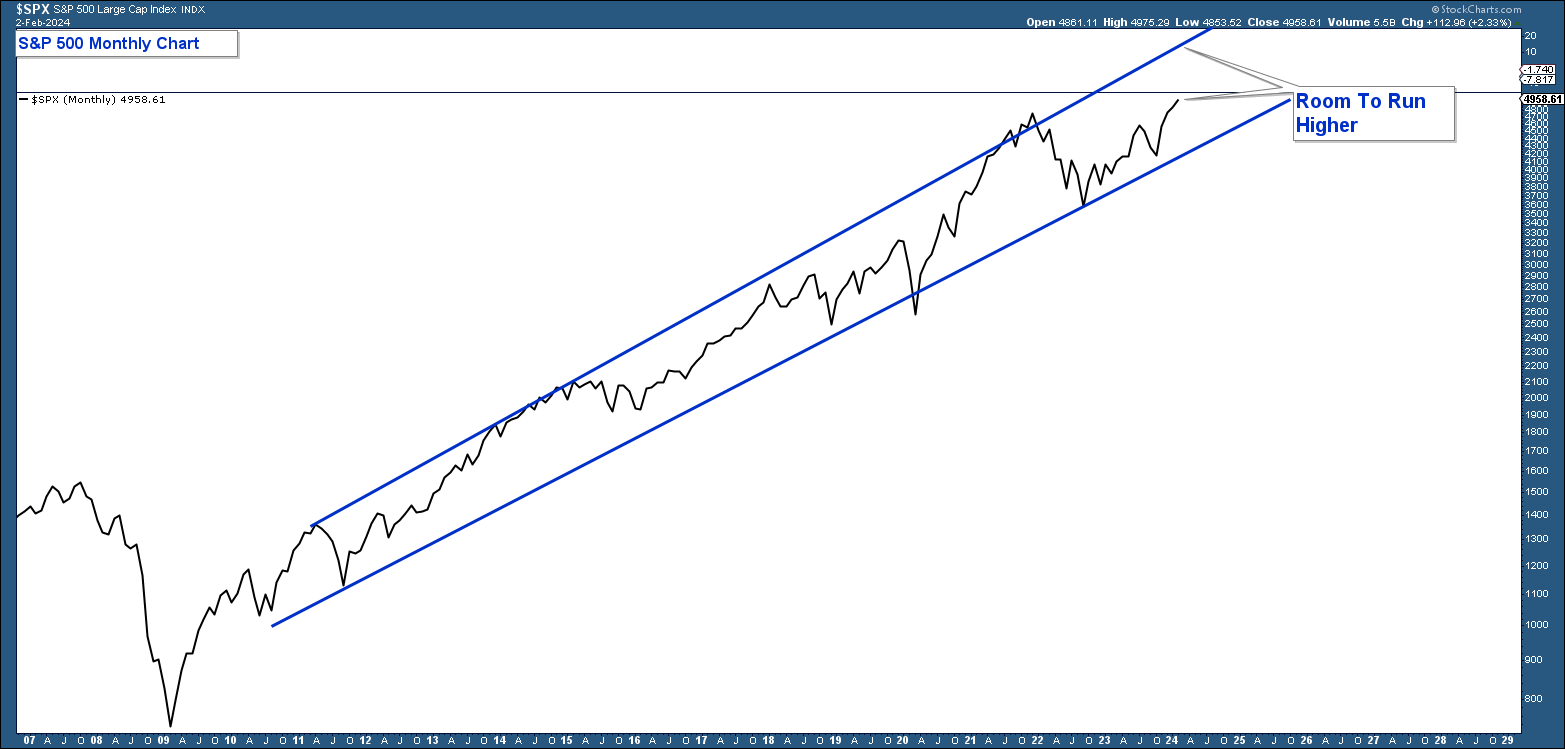
It is important to analyze market price action from a longer-term perspective. Below is a monthly chart of the S&P 500 that highlights the market’s current bull market advance that began in 2009. Price action is contained within an up-trending channel that defines the advance and depicts where the index has gotten overbought and oversold within the context of the longer-term trend.
My takeaway from the chart is that while the market may be overbought on a short-term basis, from a longer-term perspective, the market is not overbought and has more room to run as long as market technicals remain positive.

Client Account Update
Our conservative model is fully invested and our aggressive model is about 65% invested in equities.
CAN WE HELP YOU?
HERE’S AN EASY WAY TO FIND OUT:
We want clients who are a good mutual fit. To find out, we offer a no-pressure complimentary consultation. If we can help you and you want to work with us, that’s great. But if you don’t, we will give you free asset allocation direction on your retirement accounts, at no charge and with no strings attached.
If you are interested, send us an email to set up your complimentary zoom meeting.

Craig Thompson, ChFC
Email: [email protected]
Phone: 619-709-0066
Asset Solutions Advisory Services, Inc. is a Fee-Only Registered Investment Advisor specializing in helping the needs of retirees, those nearing retirement, and other investors with similar investment goals.
We are an “active” money manager that looks to generate steady long-term returns, while protecting clients from large losses during major market corrections.
Asset Solutions may discuss and display, charts, graphs, formulas which are not intended to be used by themselves to determine which securities to buy or sell, or when to buy or sell them. Such charts and graphs offer limited information and should not be used on their own to make investment decisions. Most data and charts are provided by www.stockcharts.com.
Asset Solutions is a registered investment adviser. Information presented is for educational purposes only and does not intend to make an offer or solicitation for the sale or purchase of any specific securities, investments, or investment strategies. Investments involve risk and unless otherwise stated, are not guaranteed. Be sure to first consult with a qualified financial adviser and/or tax professional before implementing any strategy discussed herein. Past performance is not indicative of future performance.

