Market Update
Where Is The Bottom Stocks fell hard this week. For the week the S&P 500 dropped 3.6%. Slowing global growth is an ongoing issue and one that is not going away any time soon. This is having a negative effect on stocks.
Now that stocks are falling the question is where is the bottom. At this point we don’t know, but the charts that I showed last week to get clues to the market top are the same charts that I will be looking at to determine a bottom. I have included all the charts that I showed last week, but have updated them to include this past week’s data.
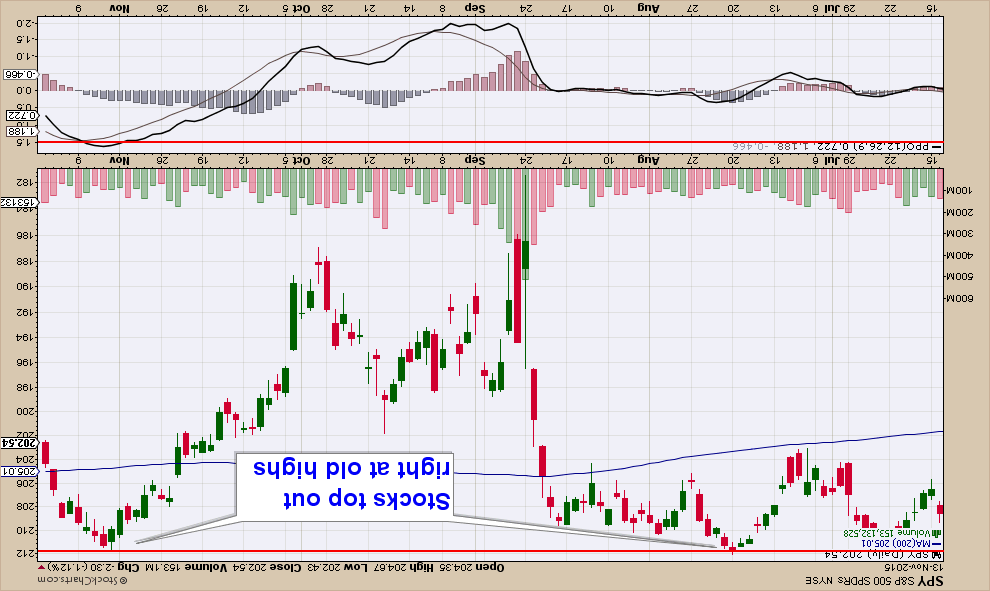
Below is a daily chart of SPY (an S&P 500 exchange traded fund). As you can see the fund is in a steep short-term downtrend. Stocks fell through their 200-day moving average on Friday.
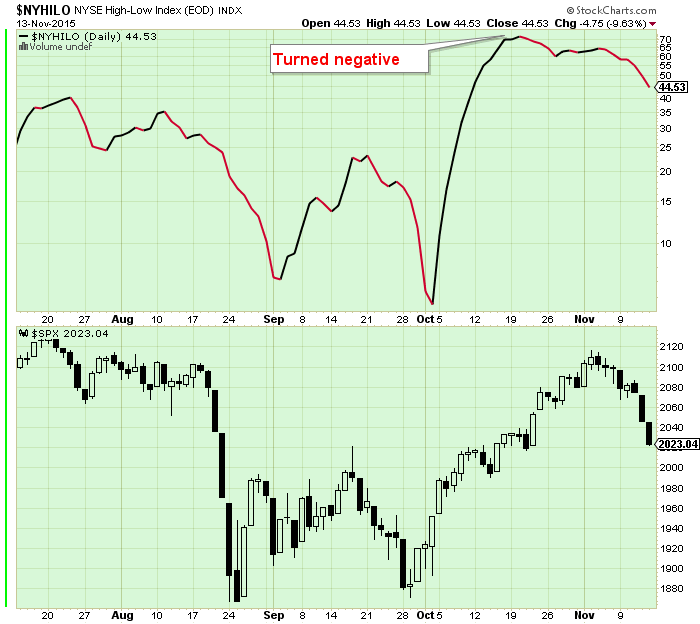
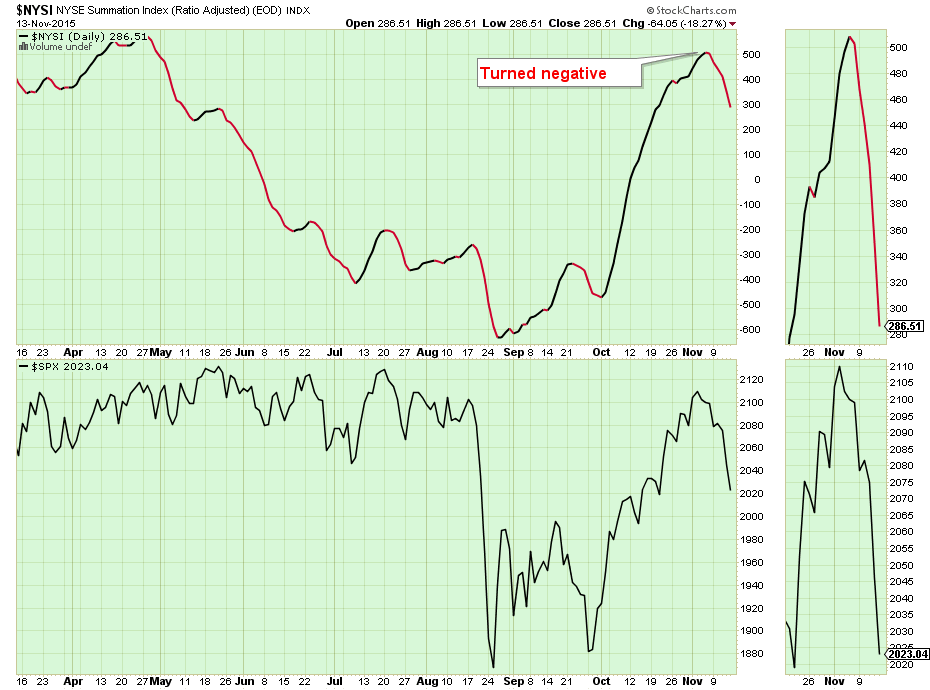
Below are the three main breadth indicators that I follow and they are all still falling.
The NYSE High-Low Index turned negative early.
The Bullish Percent Index is still declining.

The NYSE Summation Index is also still negative.
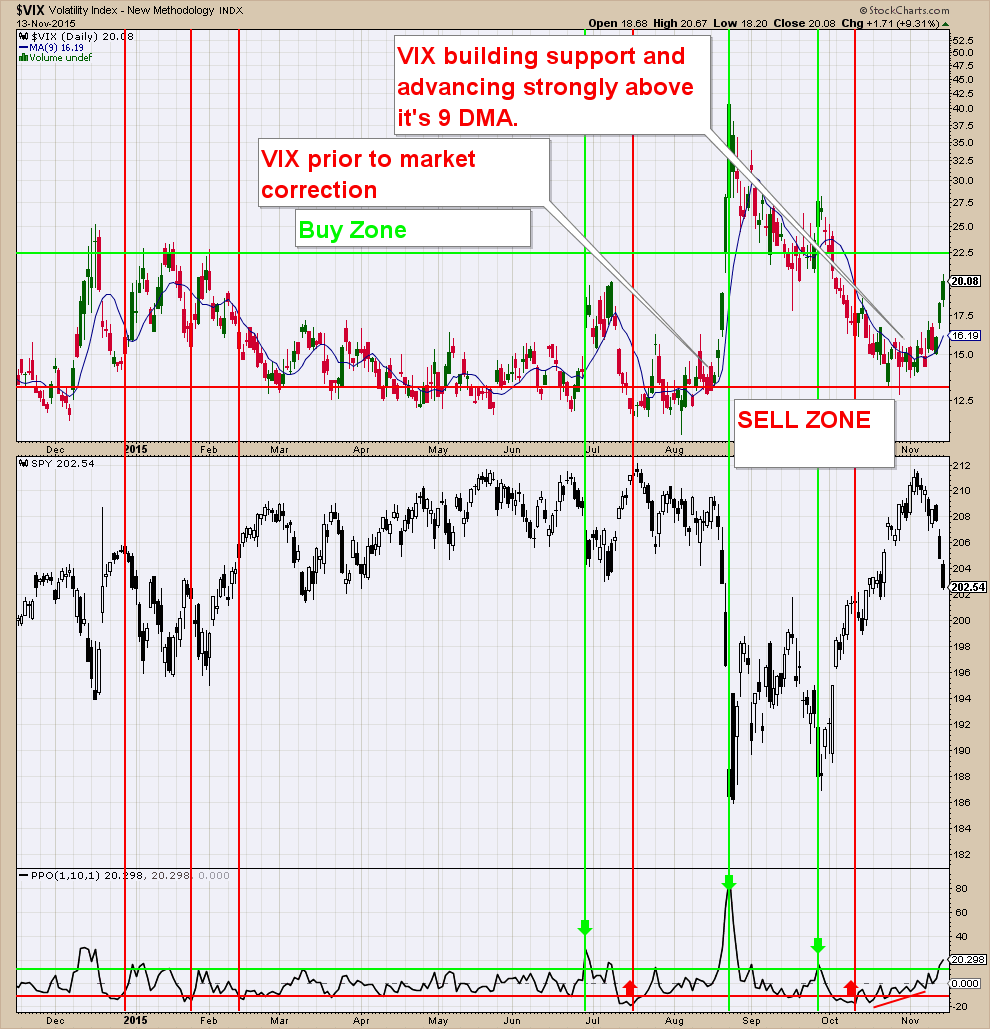
One of the main charts that I follow to determine market bottoms and tops is the VIX (Volatility Index). The VIX is a contrarian sentiment indicator that helps to determine when there is too much optimism or fear in the market. When sentiment reaches one extreme or the other, the market typically reverses course.
Below you will see the VIX chart shown above a chart of SPY. Market tops usually occur during low VIX readings, when investors are complacent, and bottoms usually occur during high VIX readings.
As you will notice the VIX fell to the levels that it was at when the initial market correction occurred back in August. Once the VIX reached this level, it formed a base, then rose up over its 9-day moving average. The VIX’s recent upturn suggests the start of a market pullback of some degree.
Notice how the VIX has risen rapidly this past week, but is still not at the excessively high levels that would give us a warning of an eminent top in the VIX and thus bottom in stocks.
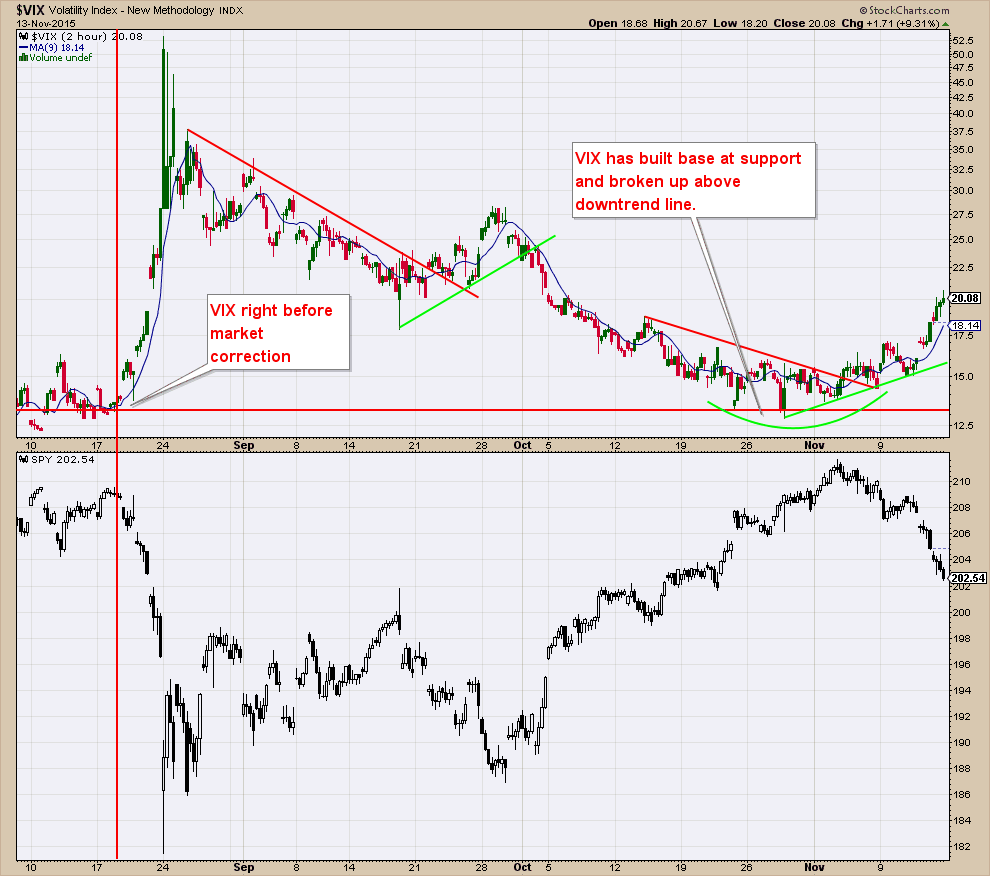
Below is the 2-hour chart of the VIX that I showed last week. You will notice the VIX formed a rounding bottom, then advanced above its downtrend line. It is currently in a strong uptrend, which signals downward pressure on stocks.
In summary, stocks are in a steep short-term downtrend. What I am looking for in a market bottom will be market breadth that turns positive and a VIX indicator that either shoots up too quickly (while stocks fall rapidly) or for the VIX to lose steam and begin to fall.
The reason I didn’t move back into the market when it formed a double bottom at the end of September is because buying into market pullbacks during bear markets have much lower odds of success. The bounces are shallow and stocks turn back down quickly. While we are not technically in a bear market, there are definitely signs that we could be moving in that direction.
Stock market risk is extremely elevated so preserving principle while the market corrects is paramount. This pullback in the market could provide an opportunity to buy back into stocks at a much better entry point (lower prices).
Client Update
Currently, we have most client accounts invested primarily in money market funds. Money market funds are safe investments that do not fluctuate in price and are a good place to park our money while we wait for stock and bond market conditions to improve.
I am looking to evaluate the current short-term stock market pullback. I believe that the opportunity lies in our ability to buy into stocks and bonds at lower prices, once this correction runs it’s course.