
Market Technicals Turn Positive
We usually publish our monthly updates on the first Monday of the month. This month I am sending it out a week early due to positive developments in the stock market.
Bottom Line: Improvement in market technicals suggest a tradable rally going into a seasonally strong end-of-year period.
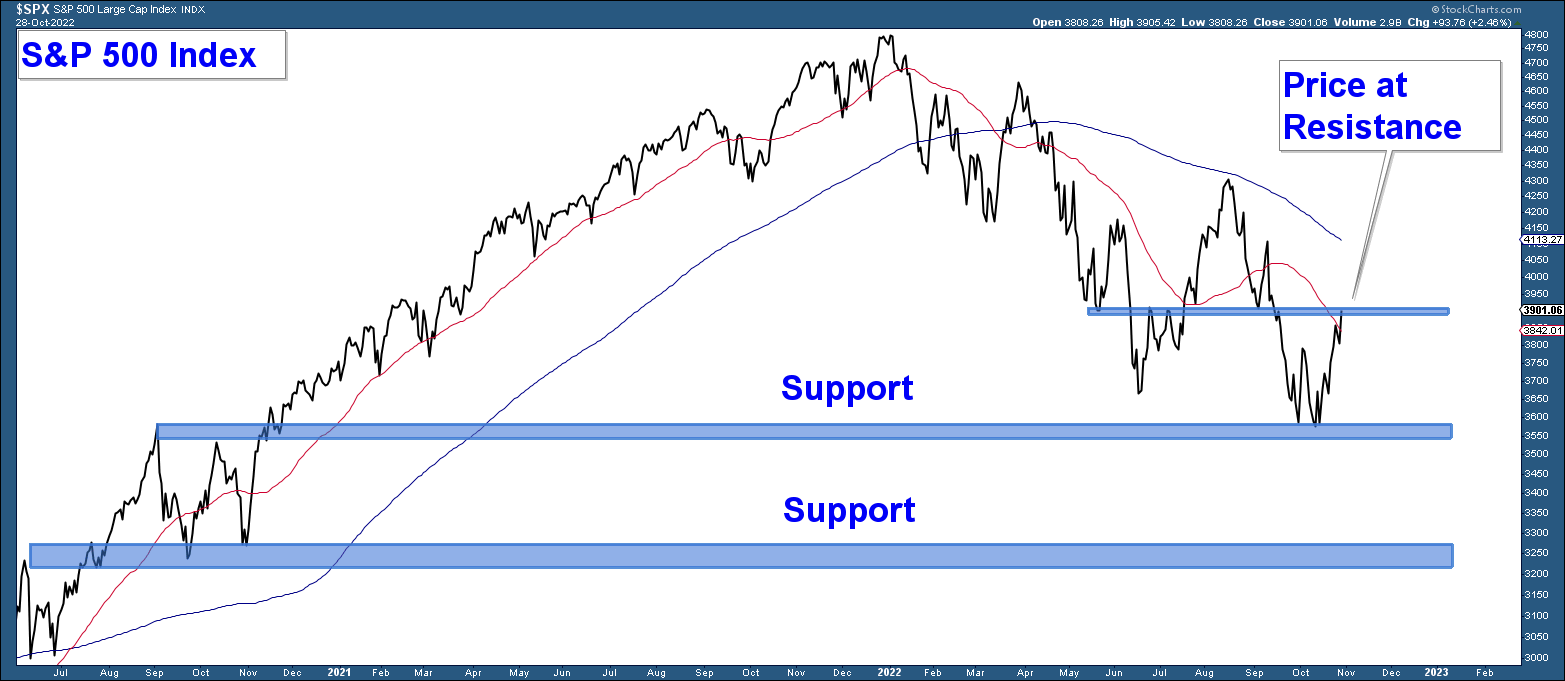
Below is a daily chart of the S&P 500. After breaching the June low the index bounced and is now sitting at resistance. Short-term momentum is positive and a strong move above resistance would be bullish.
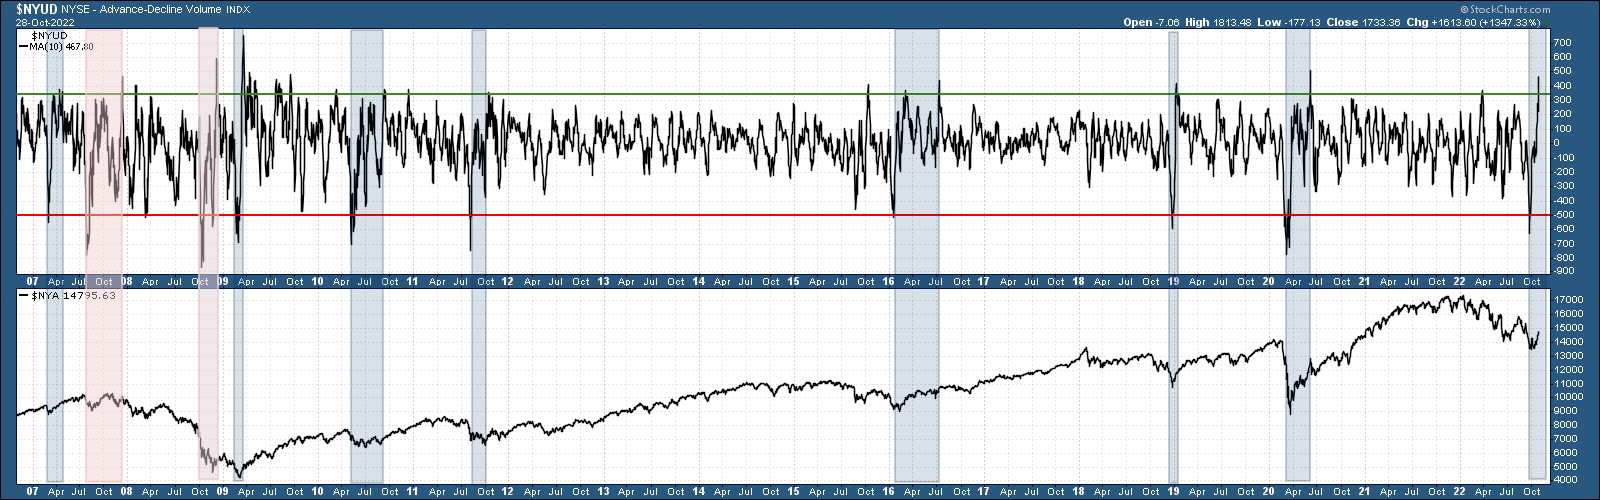
Historically when the stock market experiences a high volume move lower that proceeds a high volume move higher, it tends to signal a market bottom. The rationale for this phenomenon is that the move lower on high volume depletes the pool of bearish sellers. The bulls are then able to take advantage of this dislocation and move the market strongly higher.
The duration of the advance that follows tends to depend on the market environment meaning that during bull markets it tends to signal a long-term bottom and during bear markets, it signals a shorter-term advance or tradable rally.
In the top panel below is a chart of the NYSE advancing minus declining volume indicator. This indicator tracks the total volume of advancing stocks minus the total volume of declining stocks on the NYSE exchange. I am using a 10-day moving average to smooth out the line.
The bottoming signal is initiated when there is a move below the red line that is followed by a move above the green line. Basically charting the exhaustion of sellers followed by the dominance of buying interest.
I have highlighted those signals in red when they occurred during the last “major” bear market and in blue during all other instances.
The signals that occurred during bullish market environments (blue highlight) ended up signaling major market bottoms.
The signals that occurred during the 2008 bear market (red highlight) did not result in a long-term market advance; however, they were advances that you could take advantage of if you were nimble.
The current signal is on the far right side of the chart. We are in a bear market so I am going to presume this advance is of the shorter-term variety. Enjoy it while it lasts.
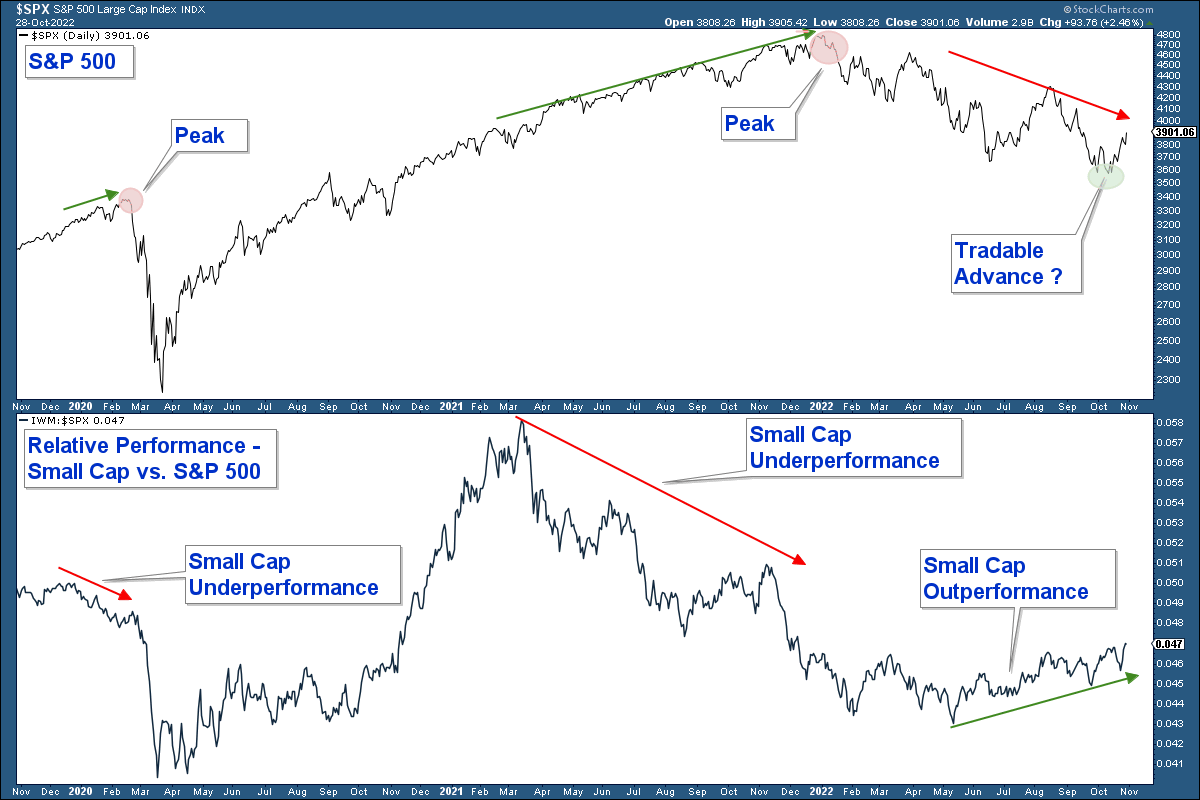
Deterioration in market breadth began in early 2021 even though major market indexes didn’t peak until the beginning of this year.
Below I have the S&P 500 Index charted in the upper panel and a relative strength chart comparing small-cap stocks to that index in the lower panel. When the relative strength line rises it indicates that small-caps are outperforming and when it falls small-caps are underperforming.
Notice the negative divergences that preceded the two previous market tops. The S&P was rising however small-cap underperformance was suggesting investors were becoming more bearish and moving out of risk-on assets.
Now look to the right side of the chart and notice how small-caps have been outperforming the index since May.
Small-cap stocks are outperforming and this is a bullish market signal.
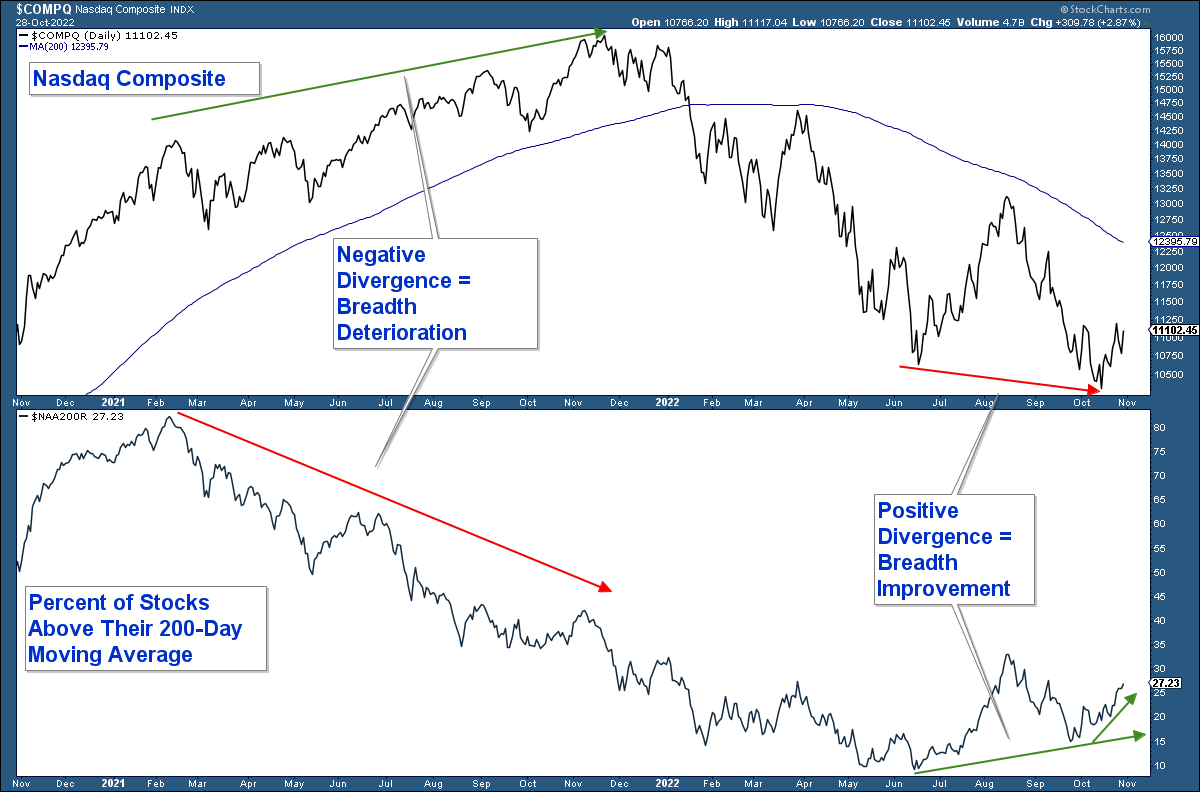
Below is a chart of the Nasdaq Composite Index in the upper panel and the percentage of those stocks within the index above their respective 200-day moving average in the lower panel.
Throughout last year the index was advancing higher; however, the number of stocks within that index above their 200-day moving average was declining. In other words, market breadth was deteriorating and suggesting internal weakness.
Now look to the far right and notice the exact opposite scenario. Market breadth has been improving.
Positive market breadth in the Nasdaq Composite Index is a bullish market signal.
There are a number of reasons why I think that the recent lows are the beginning of a shorter-term tradable advance and not a major market bottom, such as:
- Major market sectors such as Communication Services and Consumer Discretionary are still displaying weakness.
- A recession is likely to occur next year given the Fed has been raising rates aggressively.
- We still haven’t seen a strong move higher in the VIX (capitulation) which typically signals a longer-term market bottom.
The technical evidence suggests this advance could last for a number of weeks and thus money can be made by those investors that are nimble. I believe it will be an advance that rewards good stock picking because there seems to be a substantial difference in the performance of different sectors and industry groups.
Client Account Update
Over the past couple of weeks, we progressively reallocated our client accounts from a net short allocation to a net long allocation.
I sold most of our index short positions and substantially increased our stock positions.
As long as market technicals remain positive I plan to continue to add equity exposure.
CAN WE HELP YOU?
HERE’S AN EASY WAY TO FIND OUT:
We want clients who are a good mutual fit. To find out, we offer a no-pressure complimentary consultation. If we can help you and you want to work with us, that’s great. But if you don’t, we will give you free asset allocation direction on your retirement accounts, at no charge and with no strings attached.
If you are interested, send us an email to set up your complimentary zoom meeting.

Craig Thompson, ChFC
Email: [email protected]
Phone: 619-709-0066
Asset Solutions Advisory Services, Inc. is a Fee-Only Registered Investment Advisor specializing in helping the needs of retirees, those nearing retirement, and other investors with similar investment goals.
We are an “active” money manager that looks to generate steady long-term returns, while protecting clients from large losses during major market corrections.
Asset Solutions may discuss and display, charts, graphs, formulas which are not intended to be used by themselves to determine which securities to buy or sell, or when to buy or sell them. Such charts and graphs offer limited information and should not be used on their own to make investment decisions. Most data and charts are provided by www.stockcharts.com.
Asset Solutions is a registered investment adviser. Information presented is for educational purposes only and does not intend to make an offer or solicitation for the sale or purchase of any specific securities, investments, or investment strategies. Investments involve risk and unless otherwise stated, are not guaranteed. Be sure to first consult with a qualified financial adviser and/or tax professional before implementing any strategy discussed herein. Past performance is not indicative of future performance.