The Bottom Line
Bias:
We are at a major inflection point for both stocks and bonds. What happens over the next week will be paramount in determining the strength in the Stock/Bond Market.
Long-Term Positive and Short-term Neutral (at an Inflection Point) for Stocks.
Positive for Treasury Prices and Other Interest Rate Sensitive Bonds – But at an Inflection Point.
-
Long-term, the stock market is in an uptrend and looks strong. As long as the S&P 500 does not fall below about 2180, any weakness in stocks that we see in the coming weeks should be viewed as a buying opportunity once market internals turn positive.
-
Short-term the stock market is at an inflection point. The stock market has been in a short-term corrective pullback for the past 7 weeks. The advance that we saw today was extremely positive and if this is the end of the correction, I would expect the market to not drop much from here.
-
Volume related indicators are holding me back from being too bullish on today’s advance. What happens over the next handful of days will go a long way in determining if the short-term stock market correction has ended.
-
We are at an inflection point for Treasury Bonds and Treasury Yields. Bond Yields have been falling (which is positive for Bond Prices). The advance that we saw today in stocks pushed bond yields right up to resistance. As long as Treasury Yields are below this level of resistance, we should continue to see strength in Interest Rate Sensitive Bonds.
-
If we are transitioning out of short-term weakness in stocks, then I would expect Bond Yields to rise above resistance as a result of money moving out of bonds and into stocks. Since yields are sitting right under resistance, we may not have to wait long to see which direction they head.
Client Update
Client accounts are approximately fully invested. Accounts are mainly allocated in Preferred Income Funds and Interest Rate Sensitive Bond Funds with a small allocation in High Yield, Floating Rate and Emerging Markets Bond Funds.
If Treasury Yields move much higher, I will probably look to reduce or eliminate our Interest Rate Sensitive Bond Fund holdings.
If market internals continue to improve and stock prices can hold the gains of the last few days, I will look to move back into Stock Funds.
Market Technicals
Stock Market Price Action –
Positive Long-Term
Neutral Short-Term (But at an Inflection Point)
Long-Term Price Action – Positive
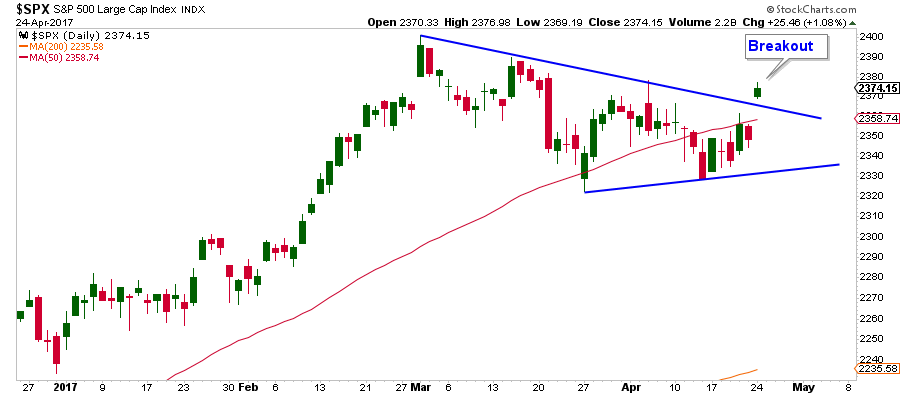
The stock market is above both it’s 50 and 200-Day Moving Average (see chart below). This is indicative of a long-term uptrend.
However, the market is correcting over the short-term. Short-term corrections are healthy, in that they serve the purpose of generating renewed buying interest once they end.

Short-Term Price Action – Neutral – At an Inflection Point
The market has made a series of lower-highs that have formed a trendline that acts as resistance. Today we saw stocks advance strongly and broke out of the wedge pattern that had formed over the past 7 weeks. From a price action perspective, this is very bullish.
If today’s advance was the end of the short-term pullback that began at the beginning of March, I would expect price to not fall too far below it’s 50-Day Moving Average which is not that far from where it closed today.
Volume Related Indicators – Negative
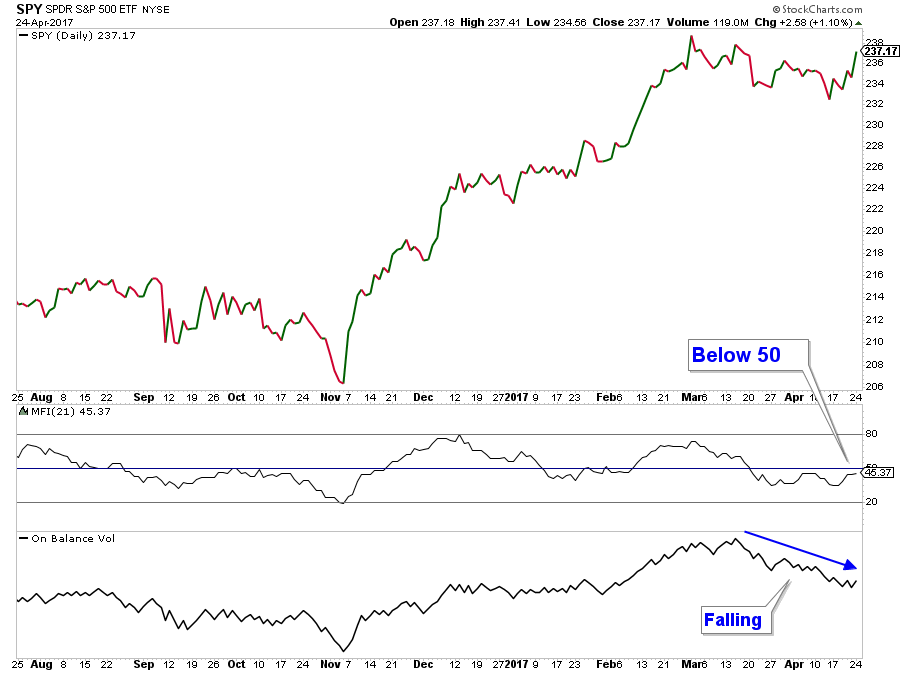
One reason why I am not overly bullish on today’s stock market breakout is that some Volume Related Indicators have not turned positive yet. Below is a chart with the S&P 500 in the upper panel, and two volume related indicators in the lower panel.
MFI is a momentum indicator similar to the Rate-of Change momentum indicator that I highlighted under the Stock Market Momentum category below. However, it incorporates volume in it’s calculation. Notice how the MFI indicator is below 50 and thus still negative, unlike the Rate-of-Change Indicator which recently advanced above 50.
In addition, On Balance Volume has been trending down strongly, and has yet to turn up decisively.
If we are at the start of a new up-leg in stocks, we need to see strong breadth and volume confirm the move.
Stock Market Momentum – Positive
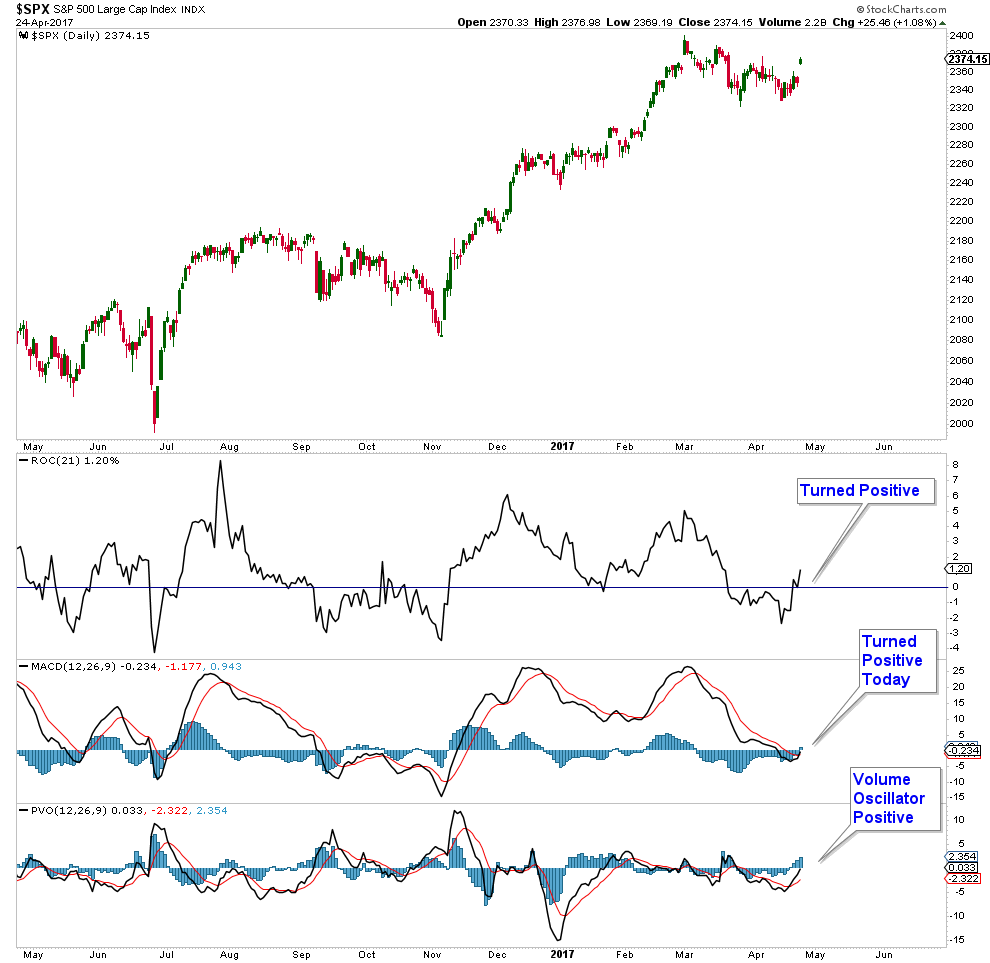
Most momentum indicators turned positive today. Below is a chart of the S&P 500 in the upper panel and three momentum indicators in the lower panels.
When the Rate-of-Change Indicator drops below zero it is a signal that short-term momentum has turned negative. Conversely, when it crosses up above zero, it is suggesting that short-term momentum has turned positive. It recently advanced above 50 signaling a positive momentum shift.
In addition the Moving Average Convergence Divergence – MACD) just turned marginally positive today.
In the lower panel (Percentage Volume Oscillator – PVO) also turned positive suggesting that the volume over the past couple of days was strong which is what you want to see when stocks break out of a consolidation.
Stock Market Breadth – Neutral
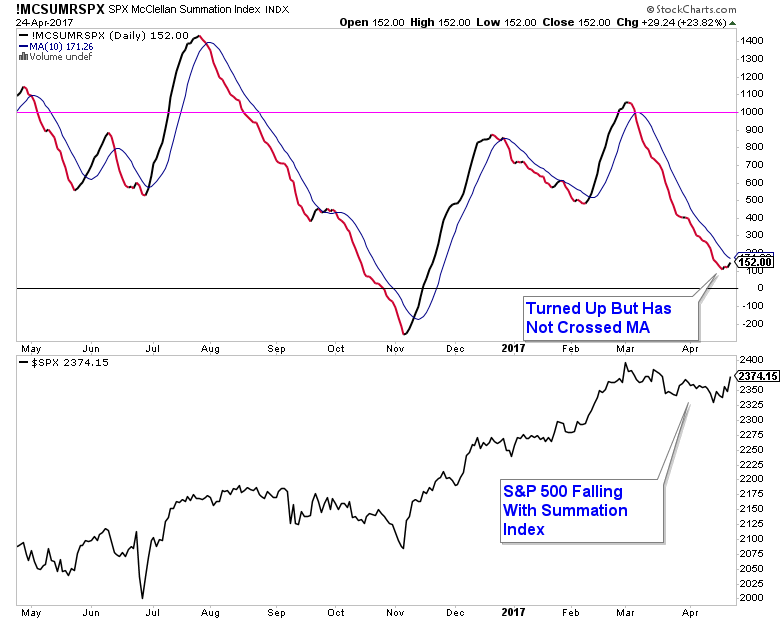
Below is a chart of the S&P 500 Summation Index along with the S&P 500 in the panel below it. The Summation Index turned down in early March and has been falling ever since. It did turn up with today’s market advance, but it is still below its moving average.
Other Market Breadth Indicators have turned positive, so I am changing my bias from negative to neutral.
Market Sentiment – Negative
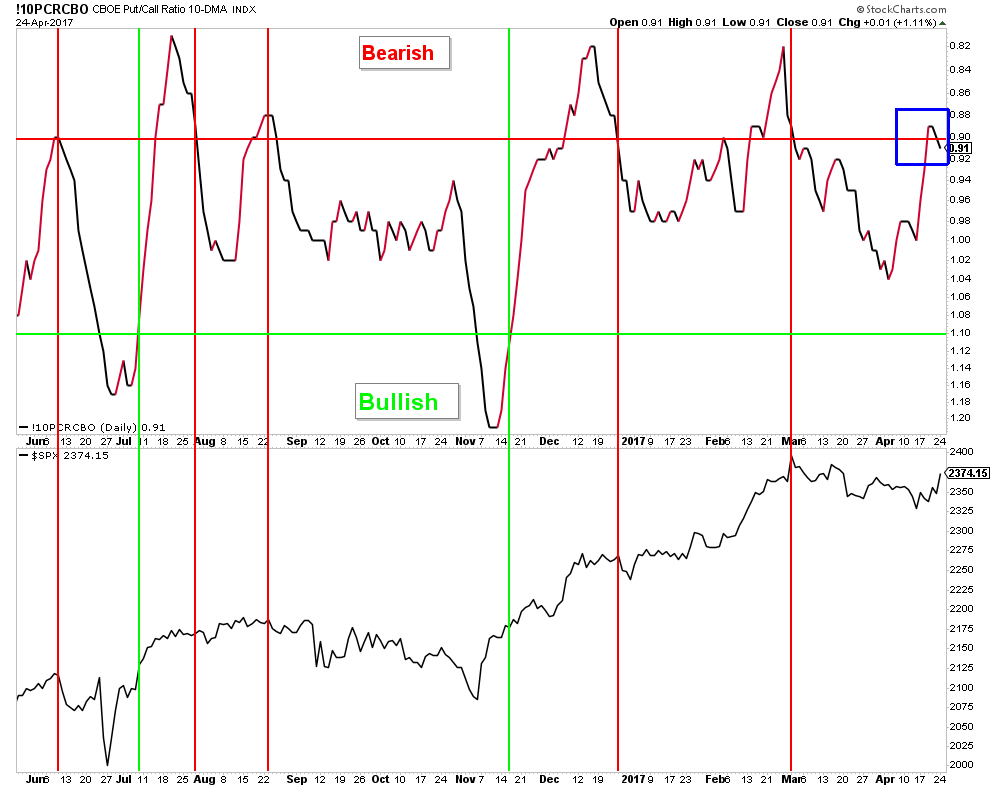
Below is a chart of the 10-Day Moving Average Put/Call Ratio. I have inverted it so that the peaks and valleys match up with the S&P 500 in the lower panel. The ratio advanced into bearish territory this week, an area that historically has signaled impending stock market weakness.
Treasury Bonds and Other Interest Rate Sensitive Bonds – Positive But at Inflection Point
After advancing strongly, Treasury Yields had trended sideways since December 2016, fluctuating between support and resistance. In the chart below, you can see that the 10-Year Treasury Yield finally fell below that very important level of support.
Yields have bounced over the past week and are now sitting right under resistance. If we are in a short-term declining yield environment, I would expect yields to not advance above this level of resistance.

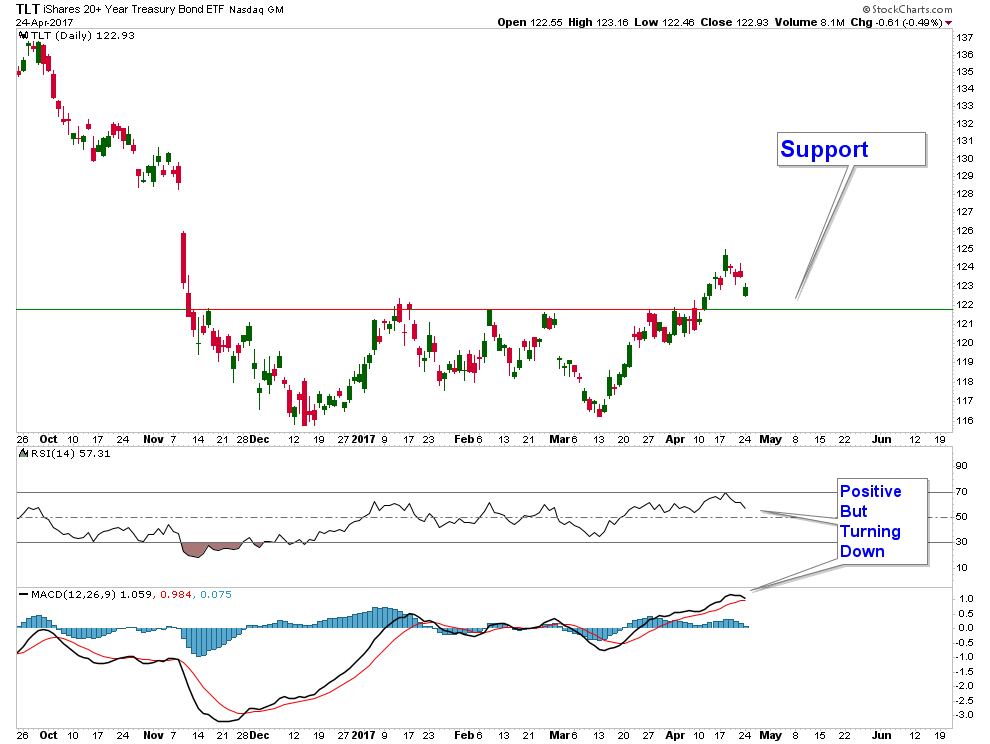
Treasury Prices behave inversely to Treasury Yields, and as a result, have been advancing as yields have fallen. Below is a chart of a 7 – 10 Year Treasury Bond ETF (IEF) and for the past 6 weeks, it has been rising. If we are still in a positive environment for Interest Rate Sensitive Bonds, I would expect price not to fall below support.
If you have any questions, please feel free to contact me.

Craig Thompson, ChFC
Email: [email protected]
Phone: 619-709-0066
About Asset Solutions
Asset Solutions Advisory Services, Inc. is a Fee-Only Registered Investment Advisor specializing in helping the needs of retirees, those nearing retirement, and other investors with similar investment goals.
We are an “active” money manager that looks to generate steady long-term returns, while protecting clients from large losses during major market corrections.
Asset Solutions is a registered investment adviser. Information presented is for educational purposes only and does not intend to make an offer or solicitation for the sale or purchase of any specific securities, investments, or investment strategies. Investments involve risk and unless otherwise stated, are not guaranteed. Be sure to first consult with a qualified financial adviser and/or tax professional before implementing any strategy discussed herein. Past performance is not indicative of future performance.