Stock Market Update 9-6-16
Market Update
Long-term the stock market is in an uptrend. Many long-term indicators are suggesting that odds favor the market to continue to advance higher eventually. Some of the indicators that are suggesting long-term strength are: the relative strength of High Yield Bonds versus Treasuries (chart in 8-15-16 video newsletter), strength in the market leading Semiconductor Index (chart in 8-15-16 video newsletter), an up-trending advance/decline line (chart in 7-18-16 newsletter), and many International Indexes that are also showing strength.
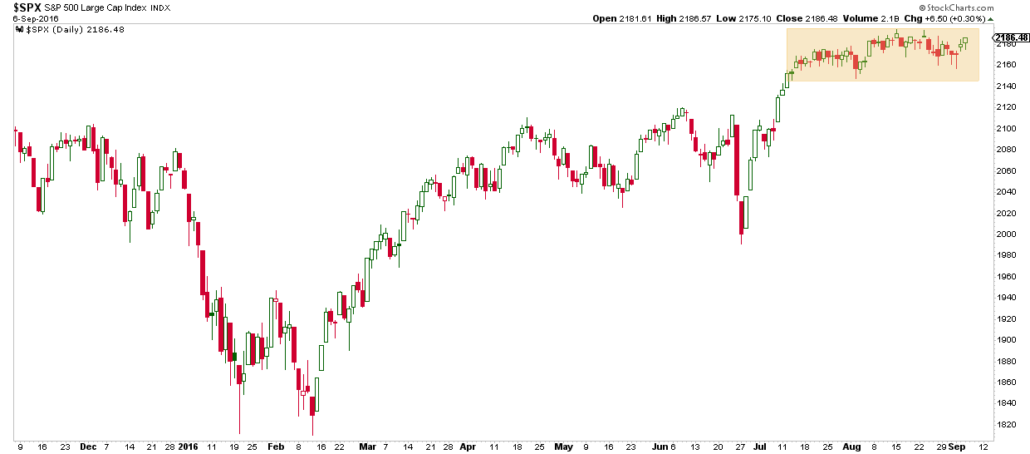
While long-term internals are positive, short-term the market has been consolidating in a tight range for the past 7 weeks (see chart below).
Last week we wrote:
“Longer-term stock market internals are still strong; however, shorter-term internals (momentum indicators and breadth indicators) have deteriorated since last week. Because of this, odds favor some type of market pullback before heading meaningfully higher.
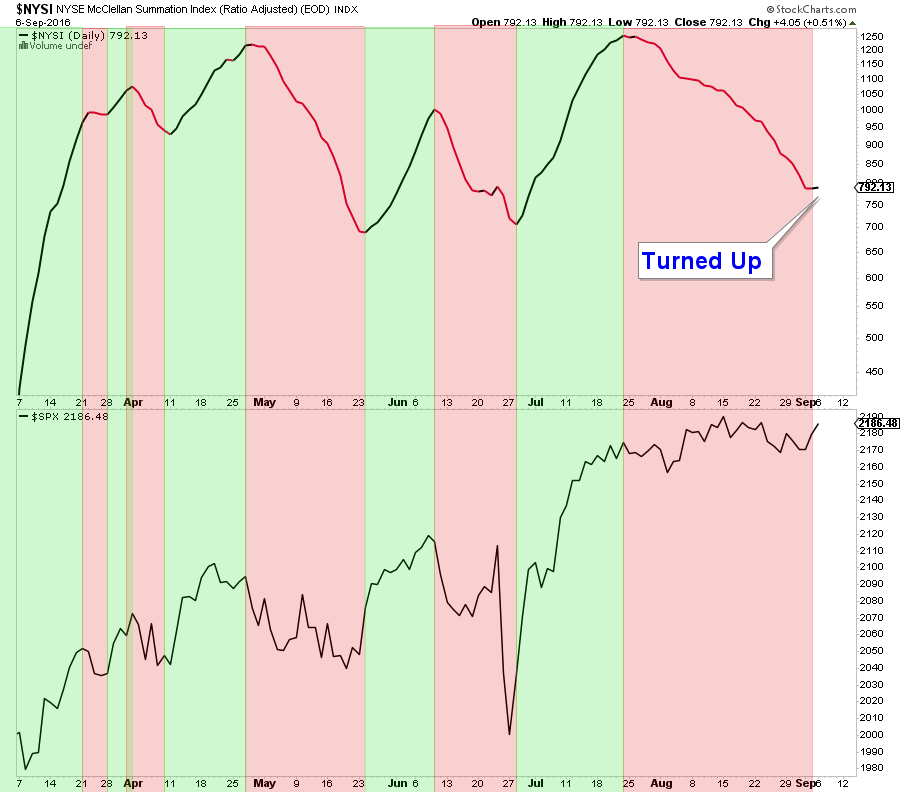
While price has not broken down yet, momentum and breadth have continued to deteriorate. Below is a chart of the NYSI Summation Index (Breadth Indicator). It is still trending down.”
Nothing much has changed this week, however the NYSE Summation Index (a breadth indicator) did turn up today (see chart below). It is too early to say that market breadth is positive. However, it is something to watch this week.
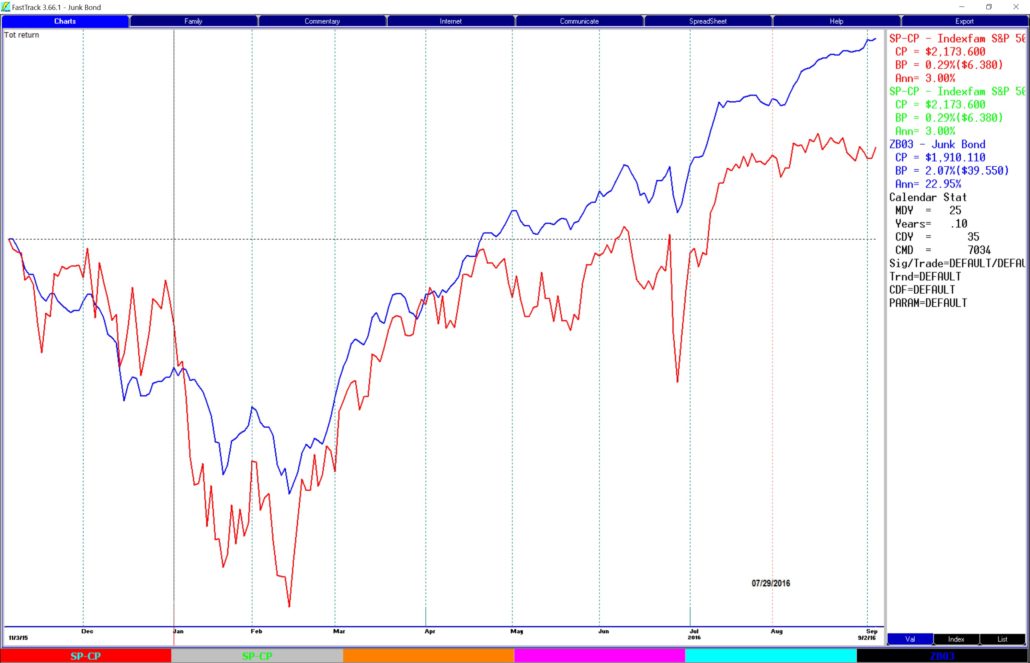
Stocks were basically flat last month; however, there were a couple of sectors we were invested in that performed relatively well. One of those sectors is High Yield Bond Funds. Below is a chart of the S&P 500 (red line) and the blue line represents a basket of High Yield Bond Funds. The S&P 500 Index advanced .29% from July 31, 2016 through September 2, 2016. Compared with the High Yield Sector that averaged 2.07%.
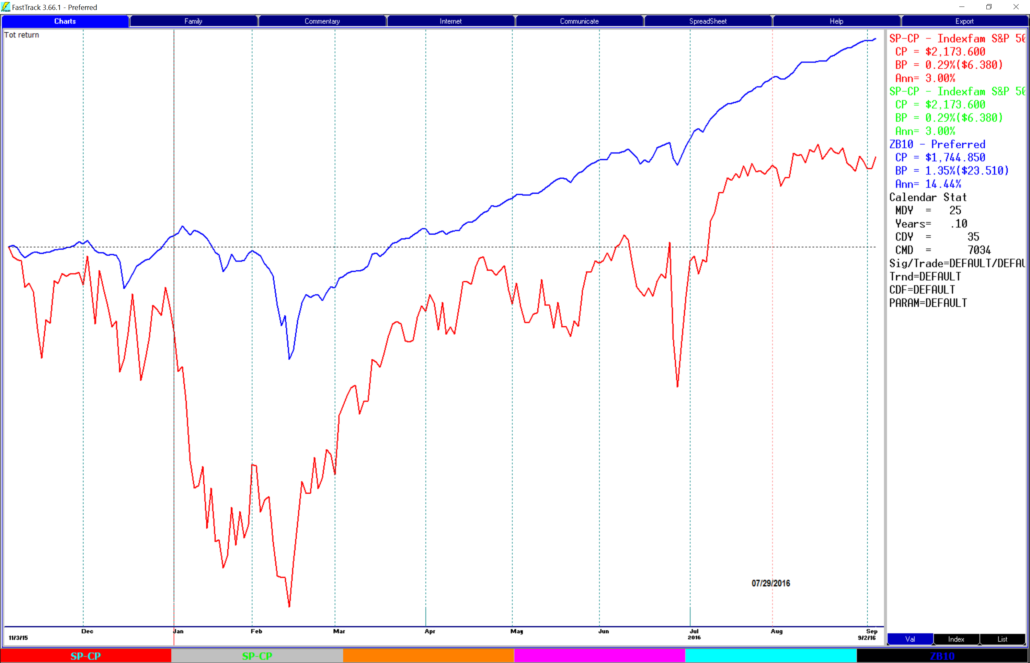
Another sector that has been providing very good risk-adjusted returns is the Preferred Securities Sector. Over that same time period a basket of Preferred Securities Funds did 1.35% (see chart below).
The Bottom Line
Bias: Positive for Stocks (no change from last week)
- Stock market price action is positive and will remain so as long as prices remain above the June 2016 lows.
- Market internals suggest a positive environment for stocks over the longer term.
- Some shorter-term market internals are flashing warning signs that we could see some market weakness over the near term. Possibly in the form of a market pullback. However, any short-term weakness has not yet been confirmed by price action.
Stock market momentum has not yet signaled a change in trend, the direction of the market is still up, and price action is still positive. So any warning sign that we are seeing in shorter-term market internals are just a signal to be cautious. Until prices rollover and momentum indicators turn negative, short-term price action remains positive.
Client Update
Client accounts are between 80% to 100% invested in lower volatility funds.
We will be looking to add funds that we have identified as providing attractive risk-adjusted return characteristics once short-term internals turn positive.
For the most part, our accounts have trended up with very minor volatility this year.
On A Personal Note
Today was back to school for our son, Aidan. He started fifth grade at a new school and didn’t know anyone. When we picked him up he said he loved it and even made a few friends. Nice way to start the school year.


Craig Thompson, ChFC
Email: [email protected]
Phone: 619-709-0066
About Asset Solutions
Asset Solutions Advisory Services, Inc. is a Fee-Only Registered Investment Advisor specializing in helping the needs of retirees, those nearing retirement, and other investors with similar investment goals.
We are an “active” money manager that looks to generate steady long-term returns, while protecting clients from large losses during major market corrections.