Stock Market Update
The market closed out last week with an increase in volatility that saw stocks fall dramatically. Over two days the Nasdaq 100 fell 6.4% and the S&P 500 dropped 4.3%. This type of market drop might lead you to wonder if last week’s fall may be the beginning of a more onerous market correction.
It is easy to let emotions impact your investment decisions when market volatility rises, but this is often a mistake. Instead, we should look at the market from a technical perspective and base our market thesis and investment allocations on fact, not emotion.
Let’s Look at the Facts
The most important chart is a price chart.
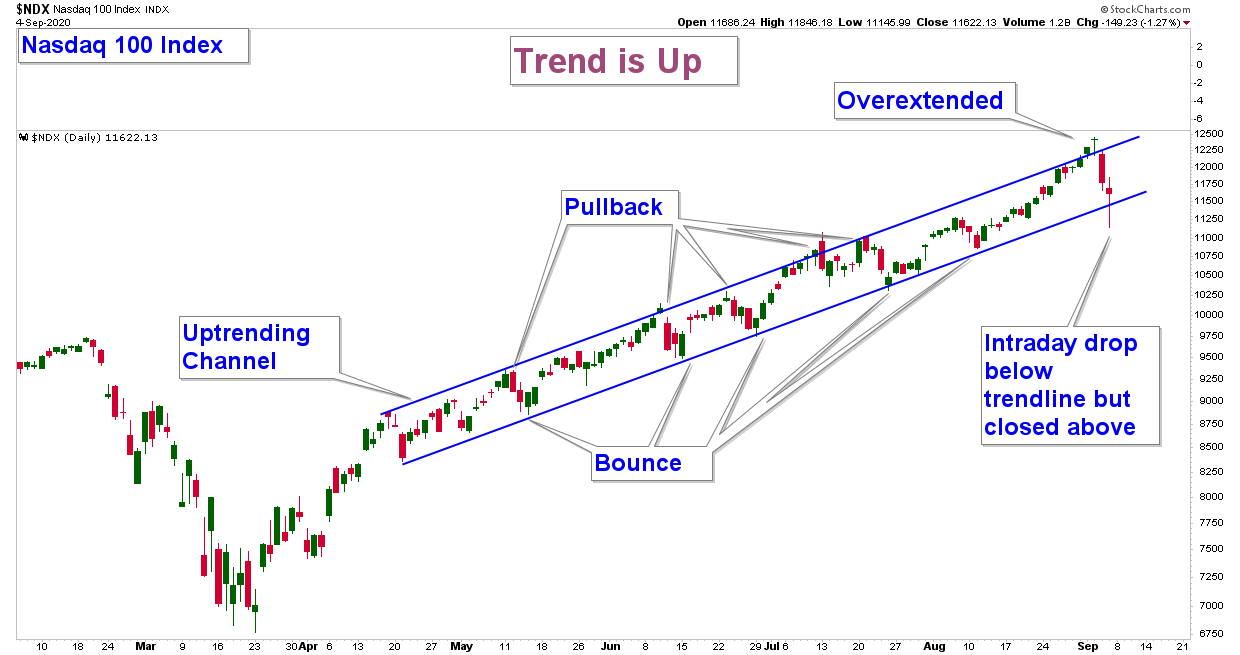
Below is the same chart that I referenced in my last update. It is a daily chart of the Nasdaq 100 which has been leading the broader market higher and advancing within a narrow uptrending channel.
So, did last week’s drop change anything? The answer is definitively no. The index did drop below the lower end of the channel on an intraday basis, but it closed within the channel. Also, the index is still making higher-highs and higher-lows, which is the definition of an uptrend.

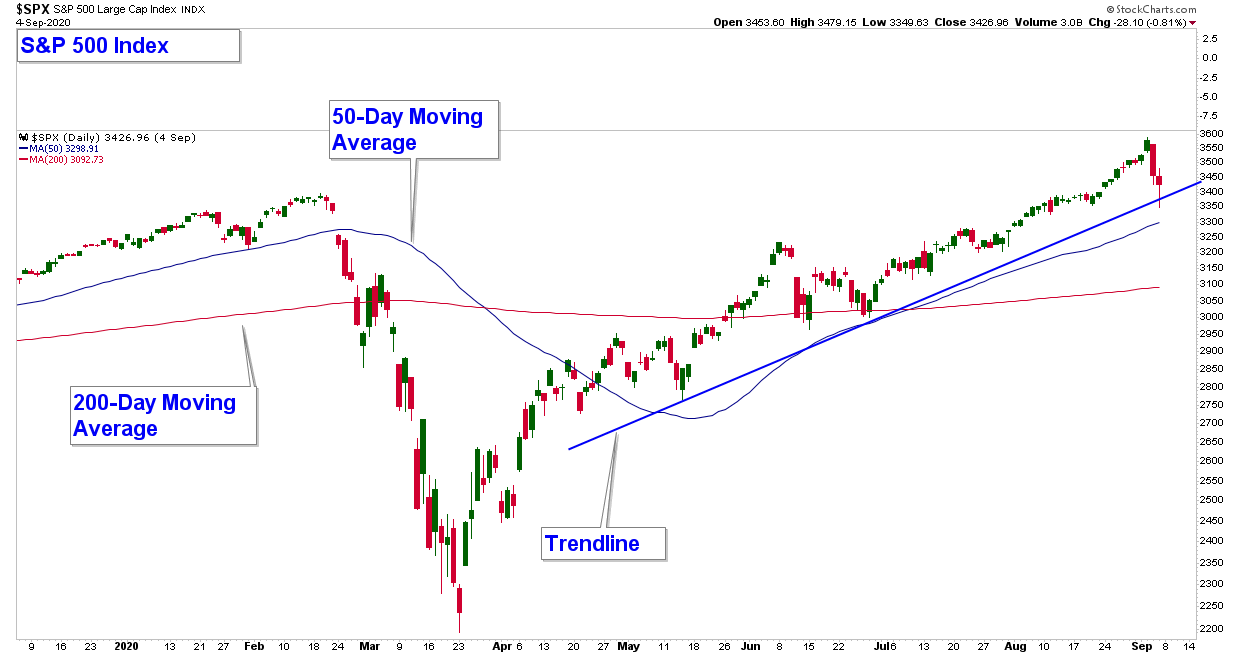
Now let’s look at a chart of the S&P 500 which is our market proxy. This index is representative of the broader stock market and is bullish for the following reasons.
- The index recently hit a new all-time high.
- It is above both it’s 50 and 200-day moving averages.
- Both those averages are trending higher.
- The price structure is an uptrend as defined by higher-highs and higher-lows.
- The index is trending above a somewhat well-defined trendline.
There is absolutely nothing bearish about this chart.

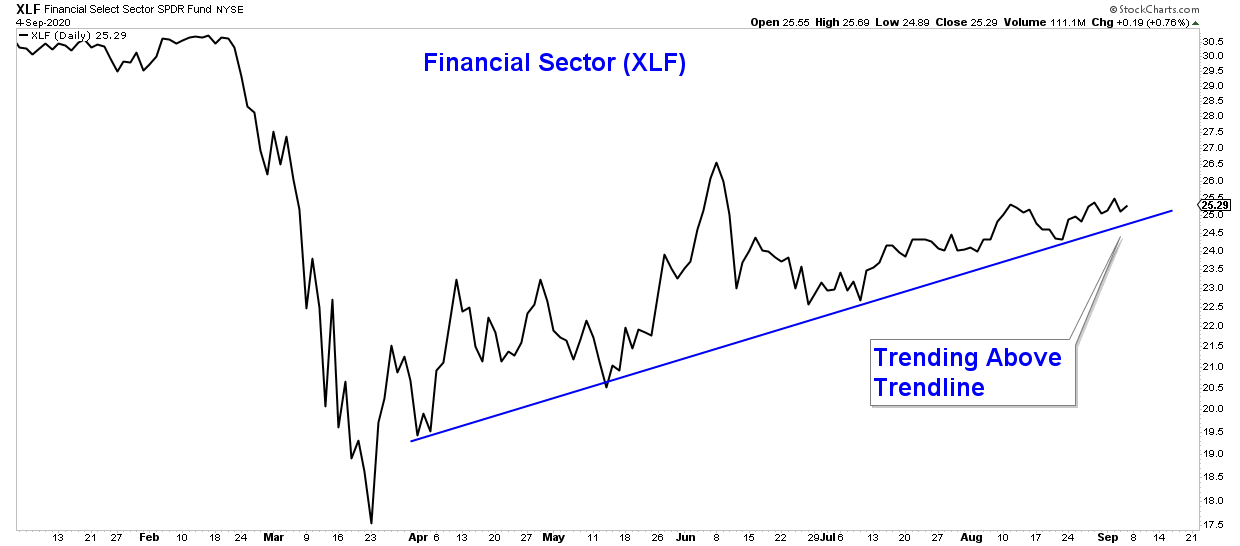
If last week’s increase in market volatility was the beginning of a major change in trend, I would have expected those sectors and industry groups that are most economically sensitive and have been underperforming recently, to have been hit the hardest. That is not what happened, however. Transports, Industrials, and Financials all are still trending higher and in fact, performed better on a relative basis through last week’s downturn.
It appears that the money that came out of those momentum stocks that have been outperforming simply got reallocated in these sectors that had been underperforming. This type of sector rotation is the hallmark of a healthy, bullish stock market.
Below is a chart of the Transportation Average which did not see big losses last week and is still trending higher above a well-defined trendline.

Industrial stocks also continue to trend higher and outperformed last week on a relative basis.

Financial stocks have been underperforming which is understandable given the low-interest-rate environment. If the broader market is in major trouble I would have expected this sector to rollover. Financials, while continuing to underperform, are still trending higher.

At this point, it looks like the recent bout of market volatility and weakness is simply a short-term pullback within a longer-term advance. Of course, that could change in the coming days so let’s take a look at what would need to occur for me to change my bullish market thesis.
Below is the same chart I showed above of the S&P 500, but with important levels of support notated. In the near-term, if this index drops below these levels I would view that as a sign that market risk is rising. And the more levels that get violated to the downside, the more risk I see in the broader stock market.
If the S&P 500 breaks down below these levels and in addition, we see a similar breakdown in the charts of Industrials, Financials, Transportation, and other important sectors/industry groups, I would look at that as confirmation of a potential major market top or at least, period of market weakness developing.

Markets fall a lot faster than they rise and thus it is important to have a risk management strategy in place and know when to reduce risk to minimize losses during times of severe market stress.
While I am currently bullish, that could change quickly.
Client Account Update
Client accounts are nearly fully invested. Conservative accounts have approximately 67% of their portfolios allocated to equities. Of that amount, about 17% is invested in Gold, Gold Miners, Silver, Cooper, and Commodity positions. The remaining amount is allocated to Bonds and Money Market Funds.
Our aggressive funds have a similar allocation but with about 93% allocated to equities. Those aggressive accounts with margin have a sizeable amount also allocated to Bond Funds.
We will continue to monitor market technicals to help manage risk in our client accounts. If conditions deteriorate we will reduce risk to limit market losses.
As always, managing risk is paramount, and protecting our clients from major losses during severe market corrections is our focus.
If you have any questions, please feel free to shoot me an email.

Craig Thompson, ChFC
Email: [email protected]
Phone: 619-709-0066
Asset Solutions Advisory Services, Inc. is a Fee-Only Registered Investment Advisor specializing in helping the needs of retirees, those nearing retirement, and other investors with similar investment goals.
We are an “active” money manager that looks to generate steady long-term returns, while protecting clients from large losses during major market corrections.
Asset Solutions may discuss and display, charts, graphs, formulas which are not intended to be used by themselves to determine which securities to buy or sell, or when to buy or sell them. Such charts and graphs offer limited information and should not be used on their own to make investment decisions. Most data and charts are provided by www.stockcharts.com.
Asset Solutions is a registered investment adviser. Information presented is for educational purposes only and does not intend to make an offer or solicitation for the sale or purchase of any specific securities, investments, or investment strategies. Investments involve risk and unless otherwise stated, are not guaranteed. Be sure to first consult with a qualified financial adviser and/or tax professional before implementing any strategy discussed herein. Past performance is not indicative of future performance.
All charts provided by: StockCharts.com
