The Long and the Short of It
The S&P has fallen 12.7 % over the past 7 trading days and is down 8.5% year-to-date. The past week is a good example of how the broad stock market can fall a lot faster than it rises.
The recent market volatility has been attributed to concerns over the spread of the coronavirus and the adverse effect that it could have on the global economy. In my opinion, black swan events like this have a much more substantial negative impact on markets when the economy is already weak and the stock market is either in a downtrend or technically weak, as is the case currently.
So where are we now? The answer, I believe, lies in what time period we are talking about. Short-term, my charts are suggesting we could be near a point where the stock market could bounce or at least stabilize. Long-term, however, the path of least resistance looks less optimistic.
Let’s look at some charts that highlight this dichotomy.
Long Term Outlook
I am going to analyze the market from both a long-term and short-term basis. When analyzing long-term market dynamics we look at Monthly and Weekly charts.
For months I have been pointing out how long-term momentum divergences were suggesting that the risk of a major market correction were elevated. This was only a warning (not a signal to sell stocks) since markets can continue to grind higher in the face of deteriorating technicals. Given last week’s severe drop in the market, we now have a signal.
Below is a monthly chart of the S&P 500 (in the middle panel) going back to 1999. In the upper panel (RSI 14) and lower panel (Slow Stochastics) are momentum indicators.
I have numbered my annotations and below is an explanation of each:
1 – Negative Divergence
A negative momentum divergence is where the stock market advances as momentum declines. I have noted those instances where this has occurred with red and green arrows.
Notice the negative divergences that preceded the major declines of 2000, 2007, 2015 and now 2020.
2 – Bearish Monthly Candles
The chart below is a candlestick chart and each candle represents one month of price data. The last candle represents the month of February. The reason that most traders use candlestick charts is that they give you much more information than the typical line chart that most people are more familiar with. This added information paints a more detailed picture of the market.
The January 2020 candle is called a shooting star. The shooting star candle is a bearish reversal signal that comes after a rally and suggests that upward momentum has stalled.
The tall, red February 2020 candle is decisively bearish because of the large decline in price over that month.
These candles in combination signal a change in trend which is long-term bearish.
3 – Slow Stochastics
Slow stochastics is a momentum indicator and it has decisively crossed below its moving average and is sitting at 80.
Neither of these momentum indicators is oversold. Thus, from a momentum standpoint, the risk of further long-term market declines are high.

Long-Term Market Summary
Long-term market technicals took a major hit this month. The warning signs continue to mount. Negative long-term technical risks, as I see them, are as follows:
• Negative momentum divergence that has been building since January 2018.
• Momentum indicators have rolled over to the extent that they have provided a sell signal
• Bearish candles on the monthly and weekly (not shown) price charts.
• Major market indexes and mega-cap stocks that had reached the upper end of their price channels as I illustrated in our last update.
• A yield curve that initially inverted early last year and has again inverted recently. Bond yield inversions have historically been an accurate predictor of economic recession, albeit with a 1 – 1.5 year lead time. For a chart, see our February Market Update.
• A bull market that is long in the tooth, coupled with an economy that has not experienced a recession in over 10 years.
• A breakdown in the reflation trade. Oil and treasury yields have fallen hard. Gold is outperforming copper and stocks. Treasury bonds are outperforming everything.
• The Dow Jones Industrial Average hit all-time highs, but the Transportation Index didn’t. This sets up a potential Dow Theory warning.
• The breakdown in the financial markets are global.
Needless to say, long-term risk is extremely elevated.
Short Term Outlook
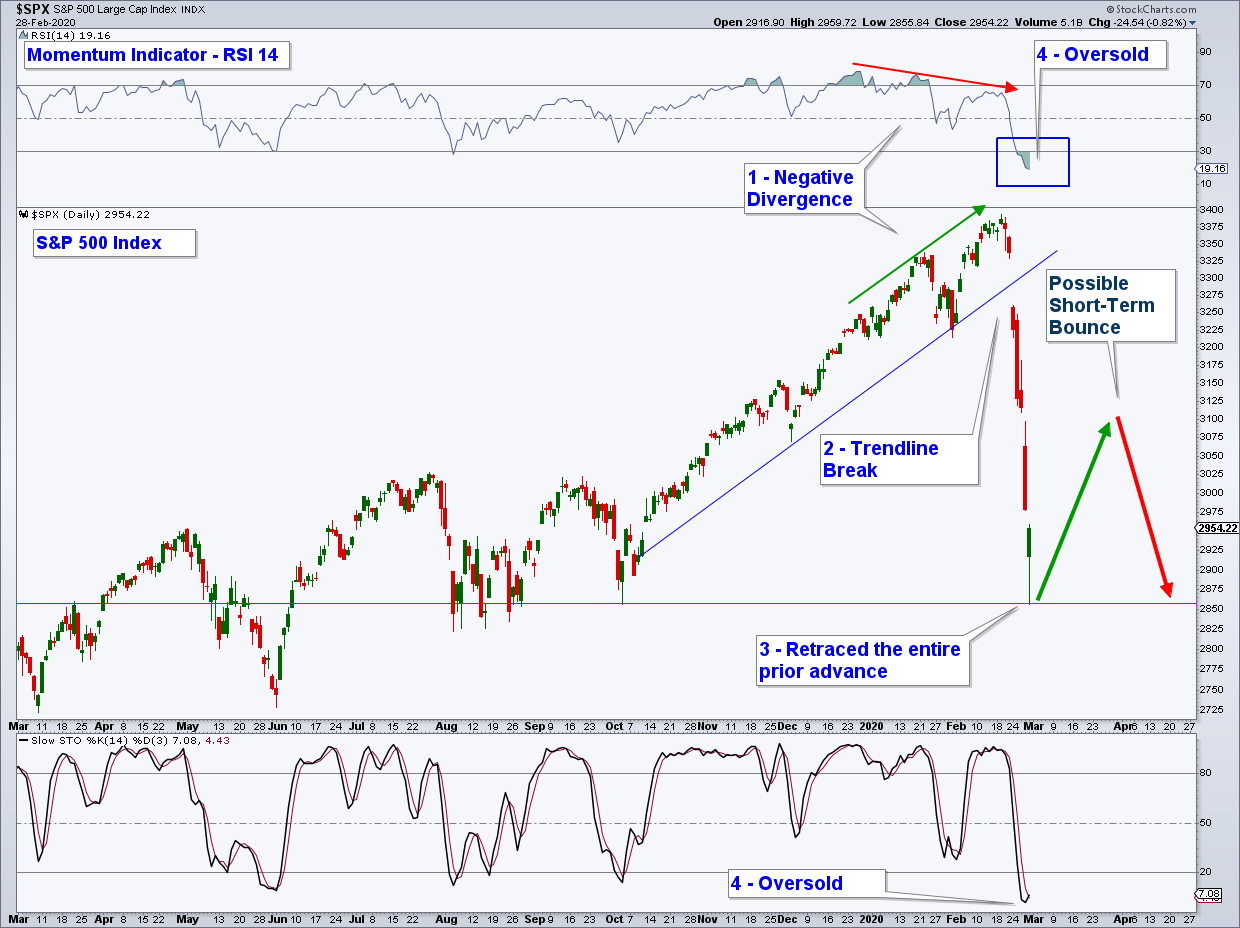
Below is a daily chart with the S&P 500 in the middle panel with the same two momentum indicators that were shown in our monthly chart above. Here is the takeaway using the same numeric notations:
1 – Negative Momentum Divergence
Momentum has been negatively diverging with price since the beginning of the year. This was a warning that the risk of a change in trend was increasing.
2 – Price Channel Breakdown
The index fell below its price channel. This was the signal that I used to determine a change in short-term trend.
3 – 100% Retracement of the Preceding Advance
The Index retraced virtually all of the preceding advance on an intraday basis. This is bearish. Constructive pullbacks only retrace up to about 61% of the previous uptrend as is explained by Fibonacci Retracement Levels.
4 – Momentum Oversold
Momentum indicators are deeply oversold and thus suggesting that we are probably close to a point where we could get some type of short-term bounce or consolidation.
Basically, everything is bearish with the exception of momentum indicators being oversold.
Market Summary
Long-term charts are suggesting that there is a significant risk that the market could continue to fall; however, short-term charts point to an oversold market that is due for some type of bounce or consolidation.
What this could mean is that we see the market bounce at some point in the coming days; but, the odds favor that bounce eventually failing only to see the market continue to fall over the longer-term. Bottom line is that risk is extremely elevated and risk management is now more important than ever.
Markets are dynamic and with each day we get a new set of data points. Thus, we reevaluate markets daily.
Client Account Update
Our equity allocation was at about 40% – 44% going into February which is on the lower end of where we would have been allocated had market technicals been positive.
Each stock had a stop price (a price that the stock gets sold at, if hit) and those stops were tight. All stocks hit their stops and were sold. We no longer hold any stock positions.
Our current allocation is about 38% invested in interest-rate sensitive bond funds and the remaining amount sitting in a money market fund.
Client accounts are up about 2% for the year.
I will continue to reallocate our client accounts strategically based upon our analysis of markets.
Now is the time to reevaluate your retirement account allocations, not later after you have incurred substantial losses.
If you are worried about how your retirement accounts are allocated, shoot me an email and we can schedule a virtual meeting to review your holdings and investment strategy.

Craig Thompson, ChFC
Email: [email protected]
Phone: 619-709-0066
Asset Solutions Advisory Services, Inc. is a Fee-Only Registered Investment Advisor specializing in helping the needs of retirees, those nearing retirement, and other investors with similar investment goals.
We are an “active” money manager that looks to generate steady long-term returns, while protecting clients from large losses during major market corrections.
Asset Solutions may discuss and display, charts, graphs, formulas which are not intended to be used by themselves to determine which securities to buy or sell, or when to buy or sell them. Such charts and graphs offer limited information and should not be used on their own to make investment decisions. Most data and charts are provided by www.stockcharts.com.
Asset Solutions is a registered investment adviser. Information presented is for educational purposes only and does not intend to make an offer or solicitation for the sale or purchase of any specific securities, investments, or investment strategies. Investments involve risk and unless otherwise stated, are not guaranteed. Be sure to first consult with a qualified financial adviser and/or tax professional before implementing any strategy discussed herein. Past performance is not indicative of future performance.
All charts provided by: StockCharts.com