The stock market is an uptrend; however, that is not to say there are not substantial risks to be aware of. Markets can advance in the face of escalating risk and deteriorating fundamentals. And markets can fall hard the longer stocks advance in the face of escalating risk.
The key is to have a good understanding of the whole risk versus reward trade-off and to use sound risk-management strategies to guard against life-changing losses that can occur because of major market corrections.
How easy it is for investors to forget the impact of the last bear market since it occurred over 10 years ago. I am NOT suggesting that we are entering a bear market. But markets are cyclical and bear markets are just a part of the business cycle. That has not changed and never will. So let’s get started and look at some charts.
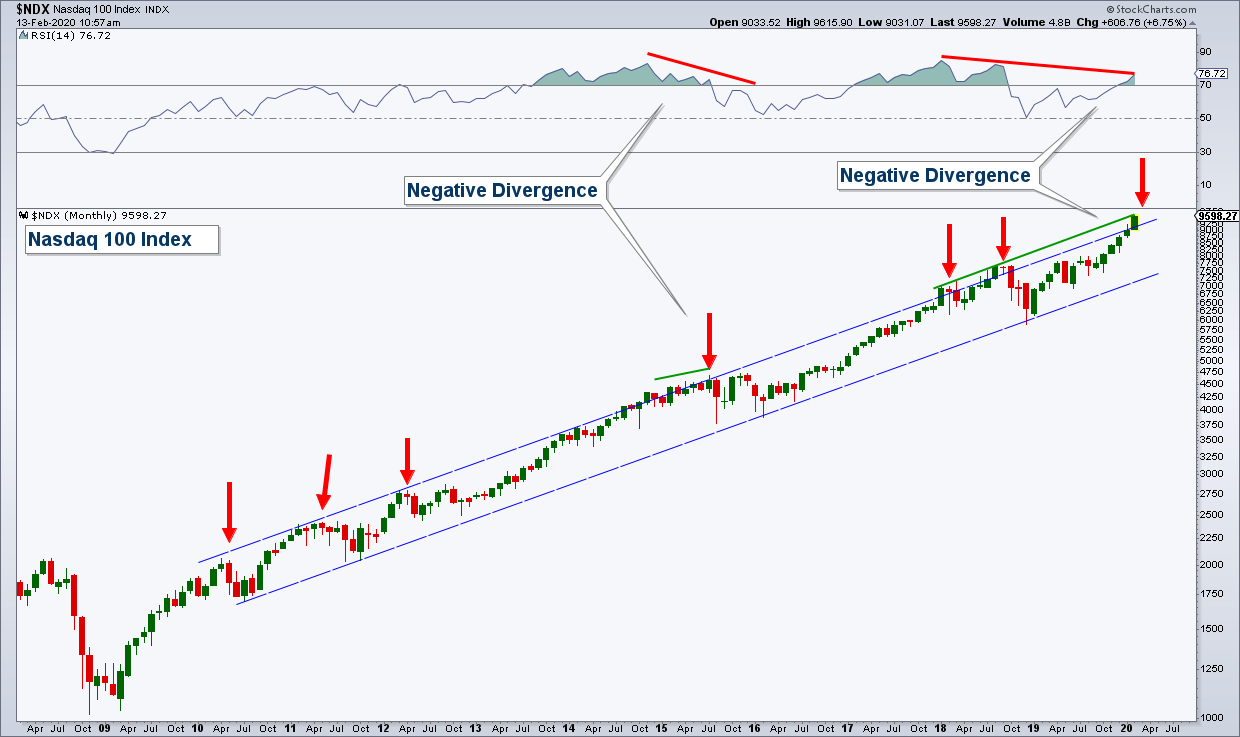
Below is a long-term (monthly) chart of the Nasdaq 100 Index going back to when the bull market began in 2009. Here is the takeaway from the chart:
• The index is advancing within a rising price channel.
• Historically, each time the index has reached the upper end of the channel it has eventually fallen to some degree (red arrows). However, there are times where the index has climbed the upper channel line before eventually falling.
• In the upper panel of the chart is a momentum indicator. When the index rises and the momentum indicator falls (negative divergence), it is a warning sign and suggests the risk of an eventual decline in the index is elevated.
Currently, the index is at the top of the channel and, in addition, has a long-term divergence in momentum.
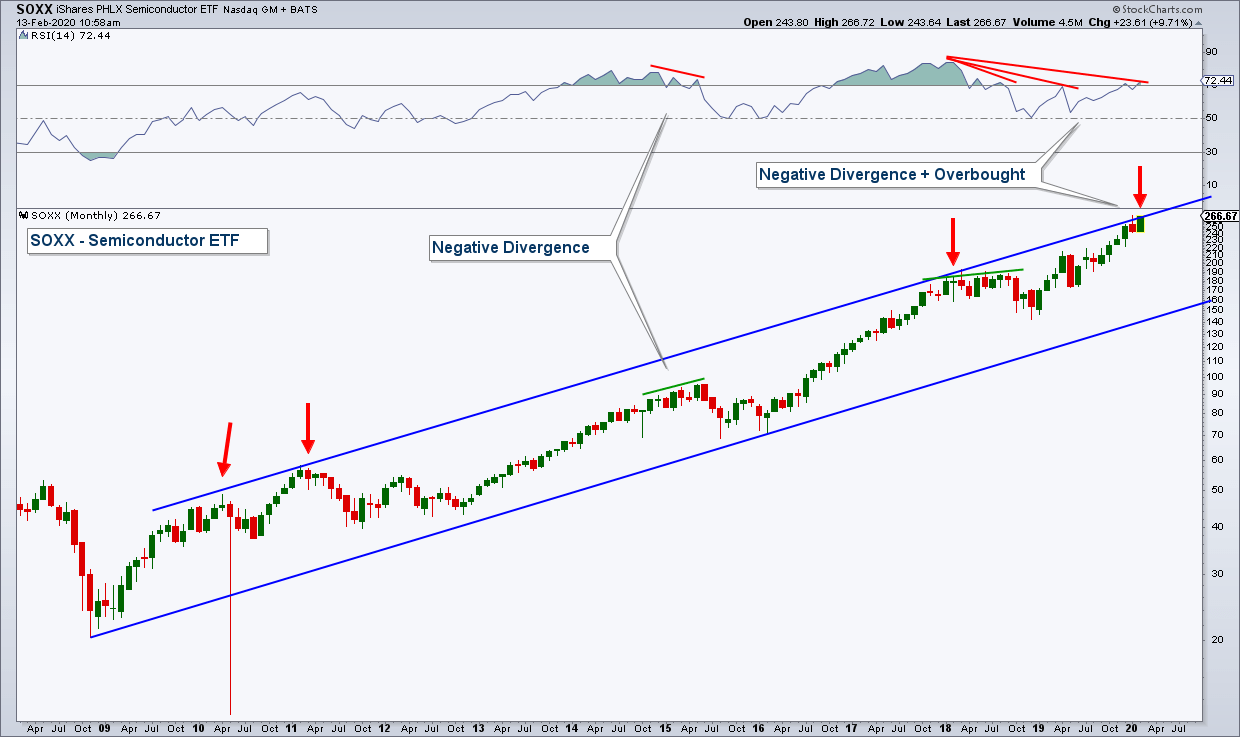
Semiconductor stocks are in a risk-on industry group and their strength or weakness can provide clues to the underlying health of the broader stock market.
Below is a chart of the Semiconductor ETF (SOXX). It looks very much like the chart of the Nasdaq 100. It is at the upper end of its channel and momentum has been diverging negatively for a long time.
Transportation stocks are an important barometer of economic/stock market health because they are strongly influenced by economic conditions.
Below is a chart of the Dow Jones Transportation Index. The takeaway from this chart:
• Transports have been under-performing the broad stock market and the index is at the lower end of its channel.
• The index is still below the all-time highs hit back in 2018. This sets up a potential Dow Theory warning.
• The fact that the Transportation Index is under-performing is another economic/stock market warning sign.
• A break below the lower end of the channel would have negative implications for the broader stock market.
![]()
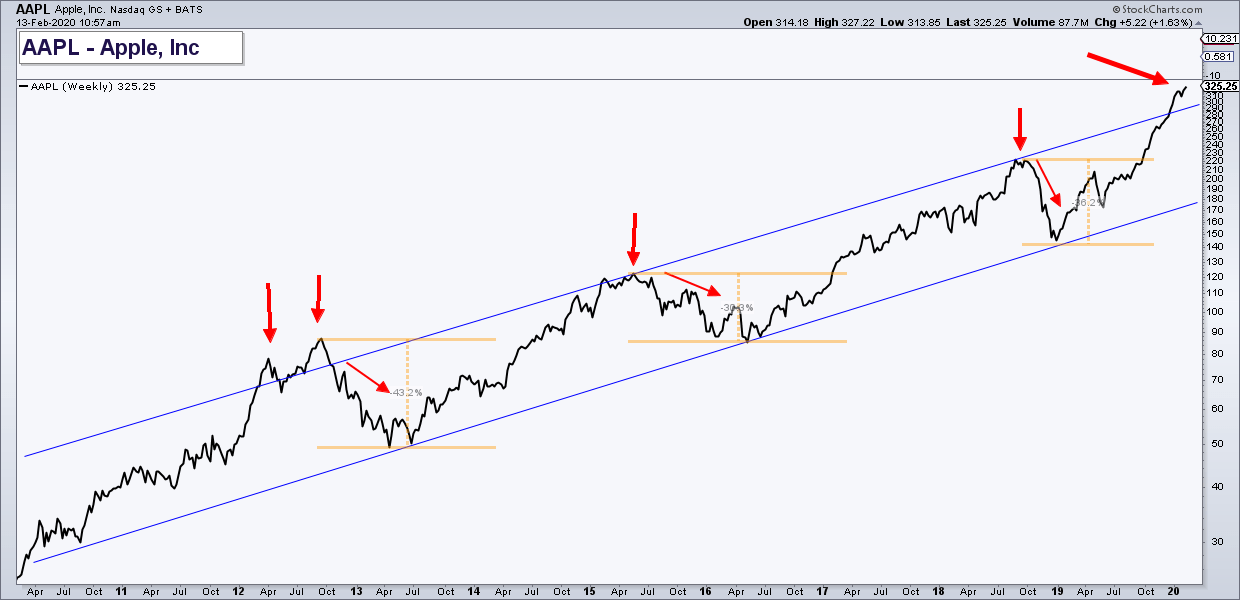
Most broad stock market indexes are capitalization weighted, meaning that the largest stocks in the index have a larger weighting than smaller stocks. As a result, the performance of the largest stocks like Apple and Microsoft is important to monitor.
Below is a long-term chart of Apple. Like the previous charts, it is extended to the upside and historically each time it hit these levels it has eventually fallen between 30% – 45%.
Below is a chart of Microsoft and it is also at the top of its long-term channel.

Summary
The market being frothy (overbought) is just a warning sign, not a signal to sell stocks. However, given that the market is overbought on a long-term basis suggests that any market correction has the potential to be large. This has to be taken into account because the more overbought the market becomes, the more the risk vs. return dynamics are not skewed in our favor.
The way to account for this is by using risk management strategies that reduce the downside, while at the same time, still be invested in the market.
Understanding risk is important because markets can fall a lot faster than they rise.
Client Account Update
Client accounts have about 44% allocated to equities. The remaining amount is allocated in interest-rate sensitive bonds.
The way Asset Solutions is dealing with the risk that we have highlighted here is by:
• We are only 44% invested in stocks which is lower than where we would be in a less risky market.
• We are overweight defensive asset classes such as gold, utilities, and REIT’s.
• Our equity holdings are made up of individual stocks that each has it’s own stop (price, that if hit, the stock gets sold). That stop gets adjusted up as the stock price rises.
• Our position size is such that we have a very small percentage of our accounts invested in any one stock, thus reducing individual security risk.
• If market conditions deteriorate, we would look to adjust our account allocations to an even more defensive posture.
I will continue to reallocate our client accounts strategically based upon our analysis of the markets.
Now is the time to reevaluate your retirement account allocations, not later after you have incurred substantial losses.
If you are worried about how your retirement accounts are allocated, shoot me an email and we can schedule a virtual meeting to review your holdings and investment strategy.

Craig Thompson, ChFC
Email: [email protected]
Phone: 619-709-0066
Asset Solutions Advisory Services, Inc. is a Fee-Only Registered Investment Advisor specializing in helping the needs of retirees, those nearing retirement, and other investors with similar investment goals.
We are an “active” money manager that looks to generate steady long-term returns, while protecting clients from large losses during major market corrections.
Asset Solutions may discuss and display, charts, graphs, formulas which are not intended to be used by themselves to determine which securities to buy or sell, or when to buy or sell them. Such charts and graphs offer limited information and should not be used on their own to make investment decisions. Most data and charts are provided by www.stockcharts.com.
Asset Solutions is a registered investment adviser. Information presented is for educational purposes only and does not intend to make an offer or solicitation for the sale or purchase of any specific securities, investments, or investment strategies. Investments involve risk and unless otherwise stated, are not guaranteed. Be sure to first consult with a qualified financial adviser and/or tax professional before implementing any strategy discussed herein. Past performance is not indicative of future performance.
All charts provided by: StockCharts.com