The Bottom Line
Bias:
Long-Term Positive and Short-Term Negative for Stocks.
Positive for Treasury Prices and Other Interest Rate Sensitive Bonds.
- The stock market is in a short-term corrective pullback. Odds favor more stock market weakness in the near-term.
- Long-term, the stock market looks strong. As long as the S&P 500 does not fall below about 2180, any weakness in stocks that we see in the coming weeks should be viewed as a buying opportunity once market internals turn positive.
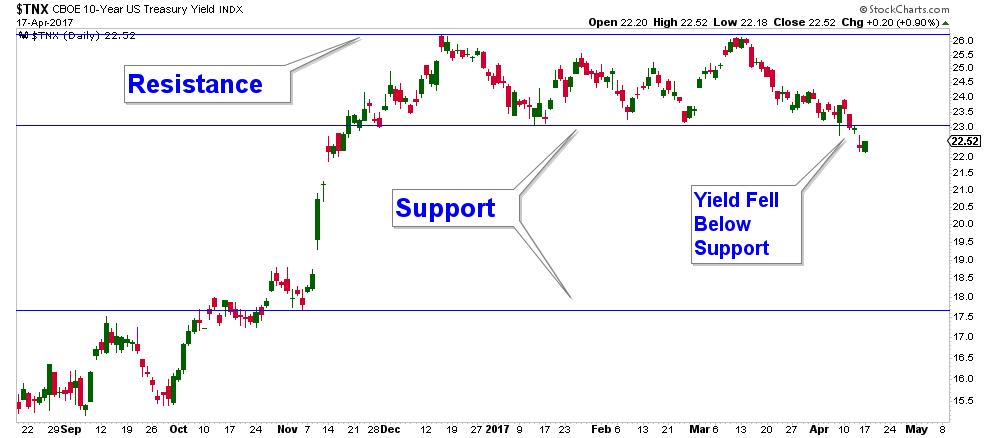
- Treasury Yields topped out Mid-December and had been oscillating between support and resistance. Last week yields finally fell below support which is positive for Treasury Prices and other Interest Rate Sensitive Investments.
- The scenario that I suggested in last week’s newsletter may have begun to play out:
“another strong leg down in stocks, the VIX rising above current levels (14), Treasury Yields falling below support and Treasury Prices rising as a result.”
Client Update
Client accounts are approximately fully invested. Accounts are mainly allocated in Preferred Income Funds and Interest Rate Sensitive Bond Funds with a small allocation in High Yield, Floating Rate and Emerging Markets Bond Funds.
I am looking to increase market exposure once the stock market bottoms and market internals improve.
Market Technicals
Stock Market Price Action – Positive Long-Term & Negative Short-Term
Long-Term Price Action
The stock market is in a short-term pullback/correction, within a longer-term uptrend (see chart below). Short-term corrections are healthy, in that they serve the purpose of generating renewed buying interest once they end.

Short-Term Price Action
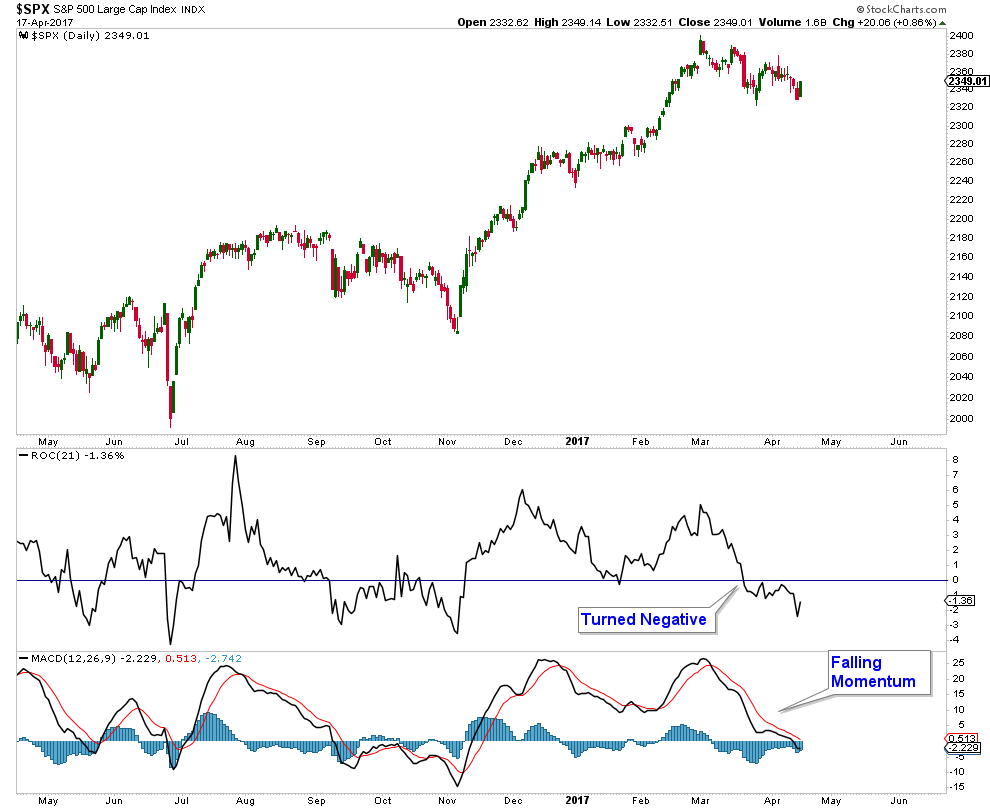
In the chart below, I am using the S&P 500 ETF (SPY) as a proxy for the stock market. Short-term price action is weak. The market has made a series of lower-highs that have formed a trendline that acts as resistance. The recent pullback in stocks has seen declining volume substantially outpace advancing volume, as I have highlighted in the chart below. Even today’s advance was on low volume.
Given that most market internals are negative, I believe that odds favor more stock market weakness before we see a resumption of the longer-term uptrend.

Stock Market Momentum – Negative
I monitor numerous momentum indicators, and most of them are negative and signaling that short-term momentum is to the downside.
One of those indicators is the Rate-of-Change Indicator. When the indicator drops below zero it is a signal that short-term momentum has turned negative. Conversely, when it crosses up above zero, it is suggesting that short-term momentum has turned positive. Notice in the chart below, the Rate-of-Change Indicator turned negative late last month.
In the lower panel is another momentum indicator (the Moving Average Convergence Divergence – MACD) and it has been falling since the market peaked in early March.
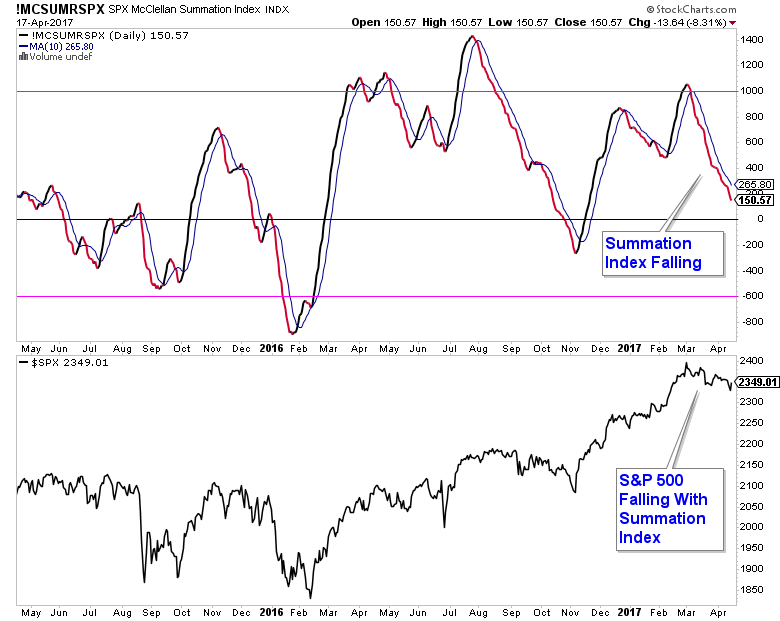
Stock Market Breadth – Negative
Below is a chart of the S&P 500 Summation Index along with the S&P 500 in the panel below it. The Summation Index turned down in early March and has been falling ever since.
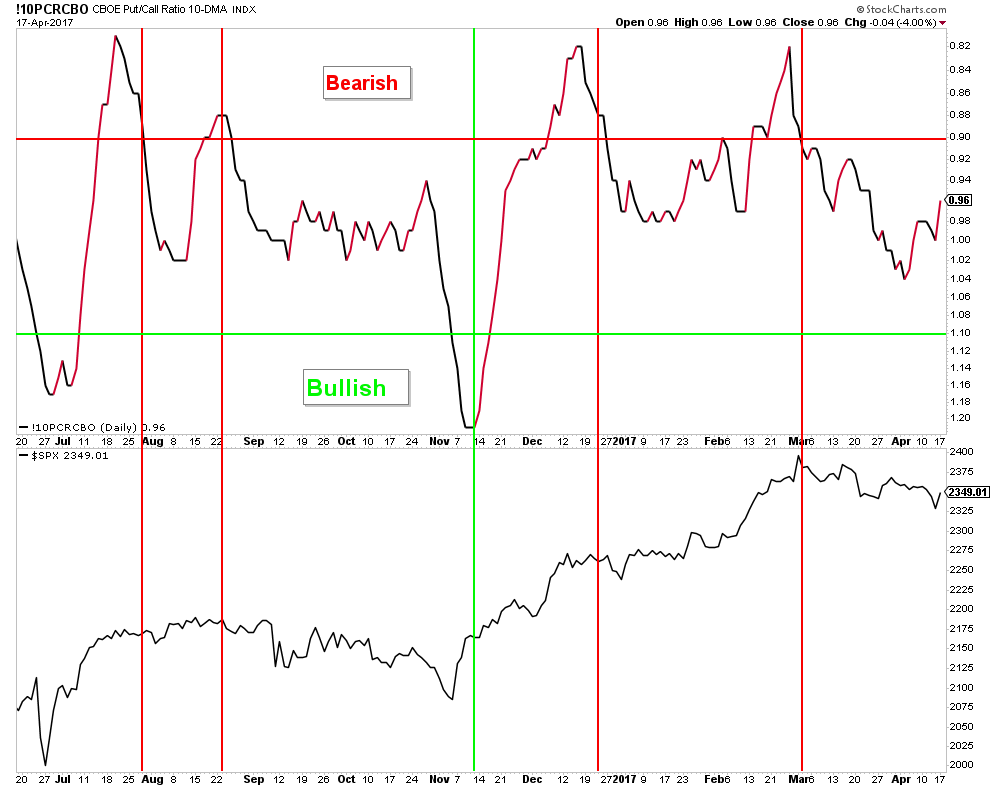
Market Sentiment – Neutral
Below is a chart of the 10-Day Moving Average Put/Call Ratio. I have inverted it so that the peaks and valleys match up with the S&P 500 in the lower panel. The ratio closed today at .96, near the middle of the chart, which is neither bullish nor bearish from a sentiment perspective.
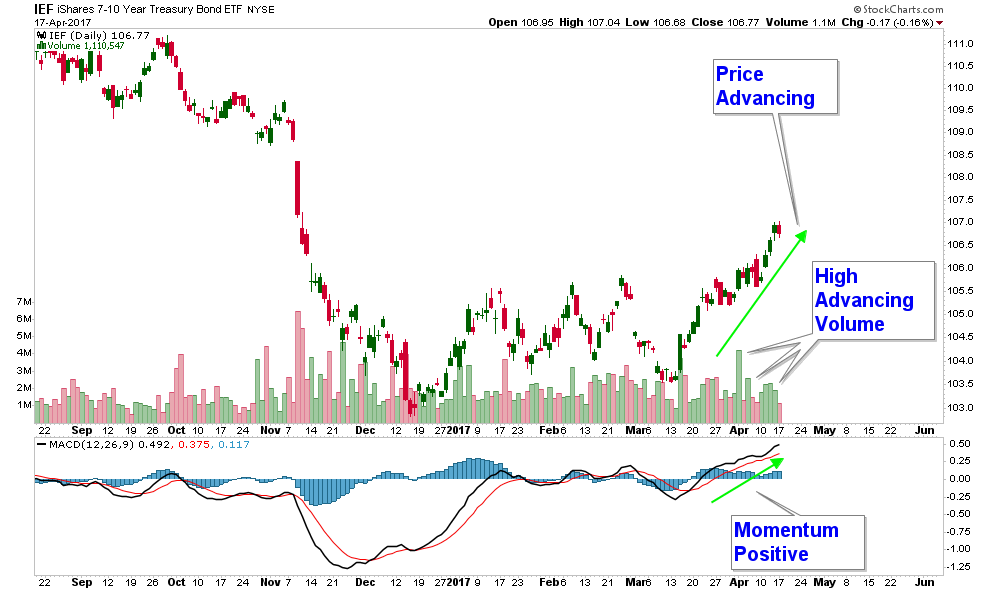
Treasury Bonds and Other Interest Rate Sensitive Bonds – Positive
After advancing strongly, Treasury Yields had trended sideways since December 2016, fluctuating between support and resistance. In the chart below, you can see that the 10-Year Treasury Yield finally fell below that very important level of support.
Treasury Prices behave inversely to Treasury Yields, and as a result have been advancing as yields have fallen. Below is a chart of a 7 – 10 Year Treasury Bond ETF (IEF). Notice how it has been advancing on high volume and the breadth indicator (MACD) in the lower panel is trending higher.
The 10 Best Places to Retire Overseas in 2017

If you have any questions, please feel free to contact me.

Craig Thompson, ChFC
Email: [email protected]
Phone: 619-709-0066
About Asset Solutions
Asset Solutions Advisory Services, Inc. is a Fee-Only Registered Investment Advisor specializing in helping the needs of retirees, those nearing retirement, and other investors with similar investment goals.
We are an “active” money manager that looks to generate steady long-term returns, while protecting clients from large losses during major market corrections.
Asset Solutions is a registered investment adviser. Information presented is for educational purposes only and does not intend to make an offer or solicitation for the sale or purchase of any specific securities, investments, or investment strategies. Investments involve risk and unless otherwise stated, are not guaranteed. Be sure to first consult with a qualified financial adviser and/or tax professional before implementing any strategy discussed herein. Past performance is not indicative of future performance.