The Bottom Line
Bias:
Long-Term Positive and Short-Term Negative for Stocks.
Bias:
Positive for Treasury Prices and Other Interest Rate Sensitive Bonds.
- We have seen a deterioration in market internals over the last few weeks. Over the near-term odds favor more stock market weakness.
- Long-term the stock market still looks strong; therefore, any weakness in stocks that we see in the coming weeks should be viewed as a buying opportunity as long as the lows of early November are not violated.
- Yields look like they have hit a short-term top which is positive for Treasury prices as well as other interest rate sensitive bonds.
Client Update
I sold all our equity holdings last week due to a continued deterioration in short-term market internals. I used some of the cash generated from those liquidations to buy Total Return Bond Funds. I will be looking to add to those positions in the coming weeks. Client accounts are between 65% – 90% invested.
Once stock market internals improve, I will look to reallocate back into equities.
We are invested in Total Return Bond Funds, High Yield Bond Funds, Emerging Market Bond Funds, and Floating Rate Bond Funds.
Market Technicals
Stock Market Price Action – Positive
The stock market is in a strong uptrend (chart below), however has lost some of its short-term momentum as can be seen in how prices have moved sideways for the past few weeks.
The S&P 500 is above both it’s 50 and 200-day moving averages and both those averages are trending higher. This is characteristic of positive stock market action.

The S&P 500 has been trending up within a channel formed by drawing trend-lines that connect previous tops and bottoms. As you can see from the chart below, the index hit the upper trend-line then began to retrace. We are in a period of short-term weakness.

Stock Market Momentum – Long-Term Positive and Short-Term Negative
In the lower panel of the chart below is a Force Index, which is a volume-based momentum indicator. We are using a 100-period time frame which is used to confirm longer-term trends.
The index turned positive in early November and is still sitting substantially above the zero line. This suggests that longer-term momentum is positive and any market weakness should be minor unless market internals deteriorates.

Short-term market internals don’t look as positive. The recent upsurge in stocks has created a short-term overbought condition and momentum is starting to wane.
In the lower panel of the chart below is the MACD Indicator. Notice each time the MACD has advanced above 2 then fell below it’s moving average it has historically marked a period where stocks have fallen to some degree.

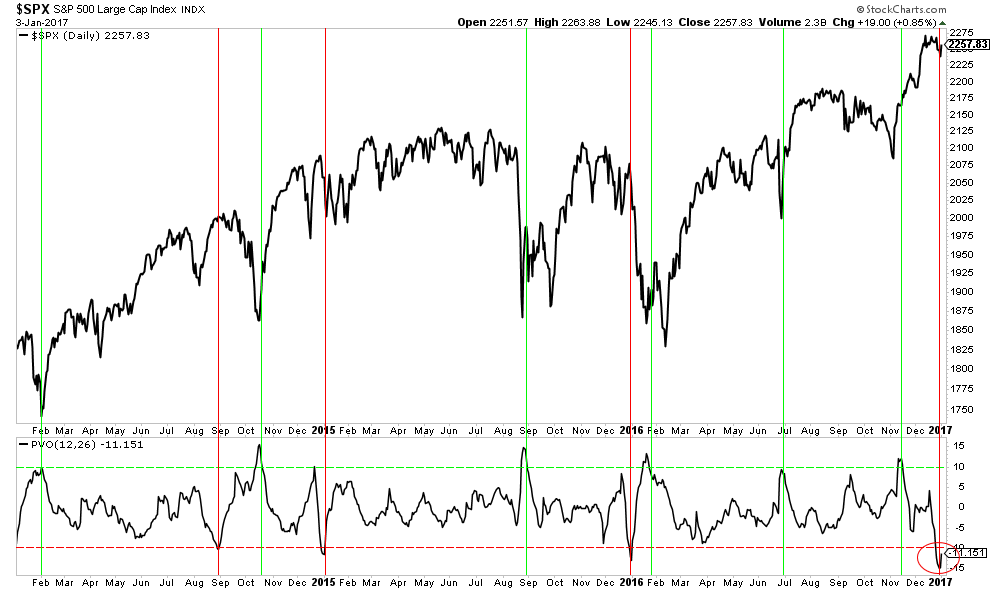
The Percentage Volume Oscillator (PVO) is a momentum oscillator for volume. It is flashing a warning signal that the odds of a stock market pullback are elevated.
In the chart below, the PVO is in the bottom panel, and when it drops below -10 historically stocks have fallen and each time it has exceeded 10 it has signaled a market bottom. I have marked these occurrences with red and green vertical lines and as you will notice it has been pretty accurate at forecasting tops/bottoms over the past few years.
Stock Market Breadth – Negative
Normally we show a chart of the NYSE Summation Index and that breadth indicator has not quite turned negative by crossing below it’s moving average. In the chart below, in the first panel below the price chart, is the Summation Index. As you will notice that Index has stalled but not quite turned negative; however, the other four Summation Indexes shown below it have all turned decisively negative.
Market breadth has turned down. This is a warning that the odds of continued stock market weakness are elevated.

Market Sentiment – Negative
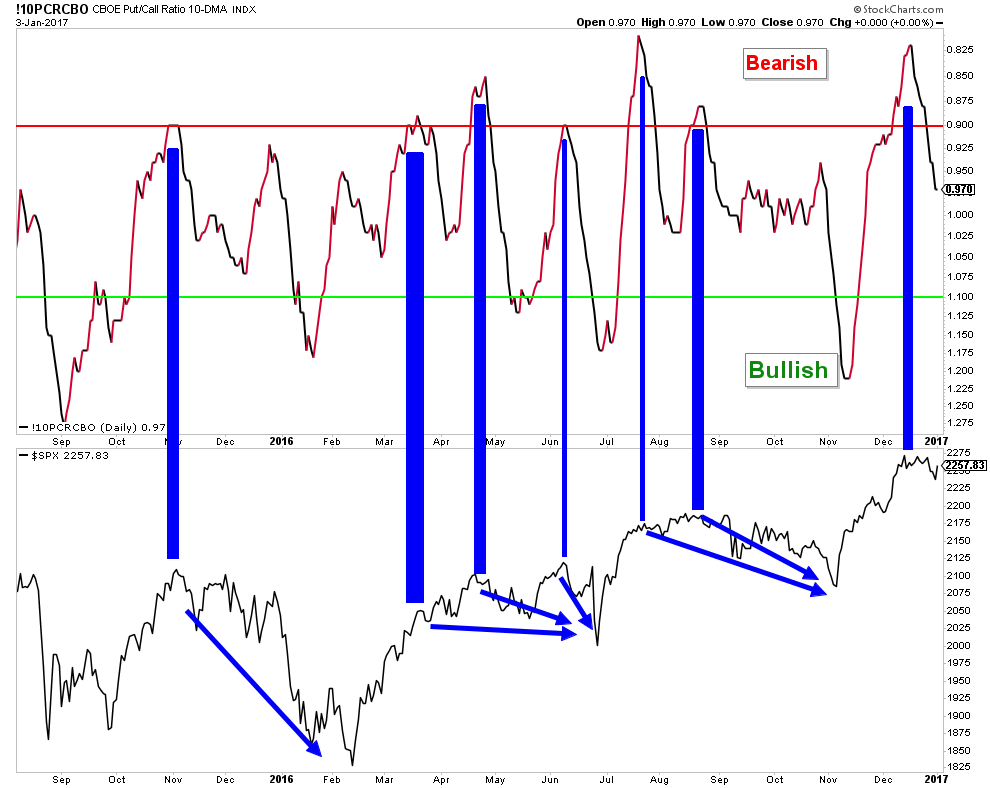
The strong market advance has sentiment warning that stocks are due for a pullback. Below is a chart of the Put/Call Ratio and it has started to fall from an elevated level. Each time this has happened recently, it has accurately warned of near-term stock market weakness.
Treasury Bonds and Other Interest Rate Sensitive Bonds – Positive
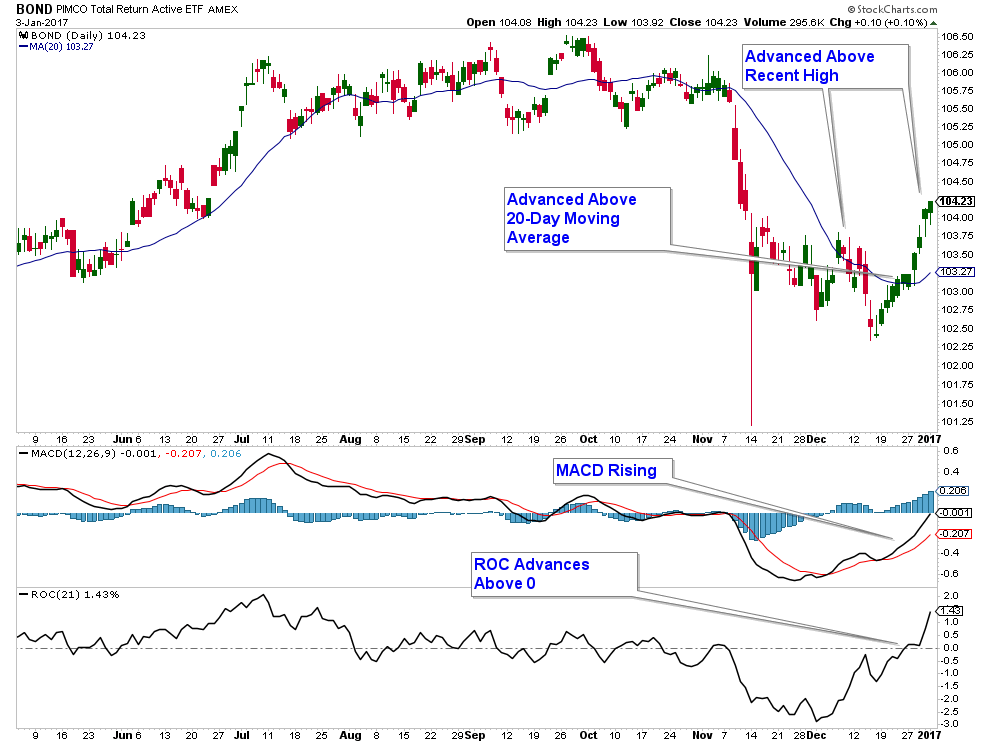
Treasury Yields have been advancing strongly since July 2016 which has caused many interest rate sensitive bonds to fall. However, it looks like yields have reached a short-term top and this has bonds forming what looks like a short-term bottom.
In the top panel below is a price chart for Pimco’s Total Return Bond Fund ETF. It has advanced above a previous high and above its 20-day moving average. In addition, both momentum indicators have recently turned positive.
I enjoy scouring the internet looking for places that I may want to live, whether for a short period of time or longer. Living in the mountains would provide hiking, skiing, and a chance to live in the middle of nature which sounds exciting. Below is a link to an interesting article that highlights some scenic mountain towns that I find enticing.
America’s Favorite Mountain Towns

If you have any questions, please feel free to contact me.

Craig Thompson, ChFC
Email: [email protected]
Phone: 619-709-0066
About Asset Solutions
Asset Solutions Advisory Services, Inc. is a Fee-Only Registered Investment Advisor specializing in helping the needs of retirees, those nearing retirement, and other investors with similar investment goals.
We are an “active” money manager that looks to generate steady long-term returns, while protecting clients from large losses during major market corrections.
Asset Solutions is a registered investment adviser. Information presented is for educational purposes only and does not intend to make an offer or solicitation for the sale or purchase of any specific securities, investments, or investment strategies. Investments involve risk and unless otherwise stated, are not guaranteed. Be sure to first consult with a qualified financial adviser and/or tax professional before implementing any strategy discussed herein. Past performance is not indicative of future performance.