I believe that the stock market is at a crossroads. Major stock market indexes are long-term extended and momentum has rolled over. However, in the short-term, those indexes have bounced and are now at a point where if we are in a bear market environment, I would expect them to resume their descent. What happens from here will be very telling regarding the longer-term trend of the stock market.
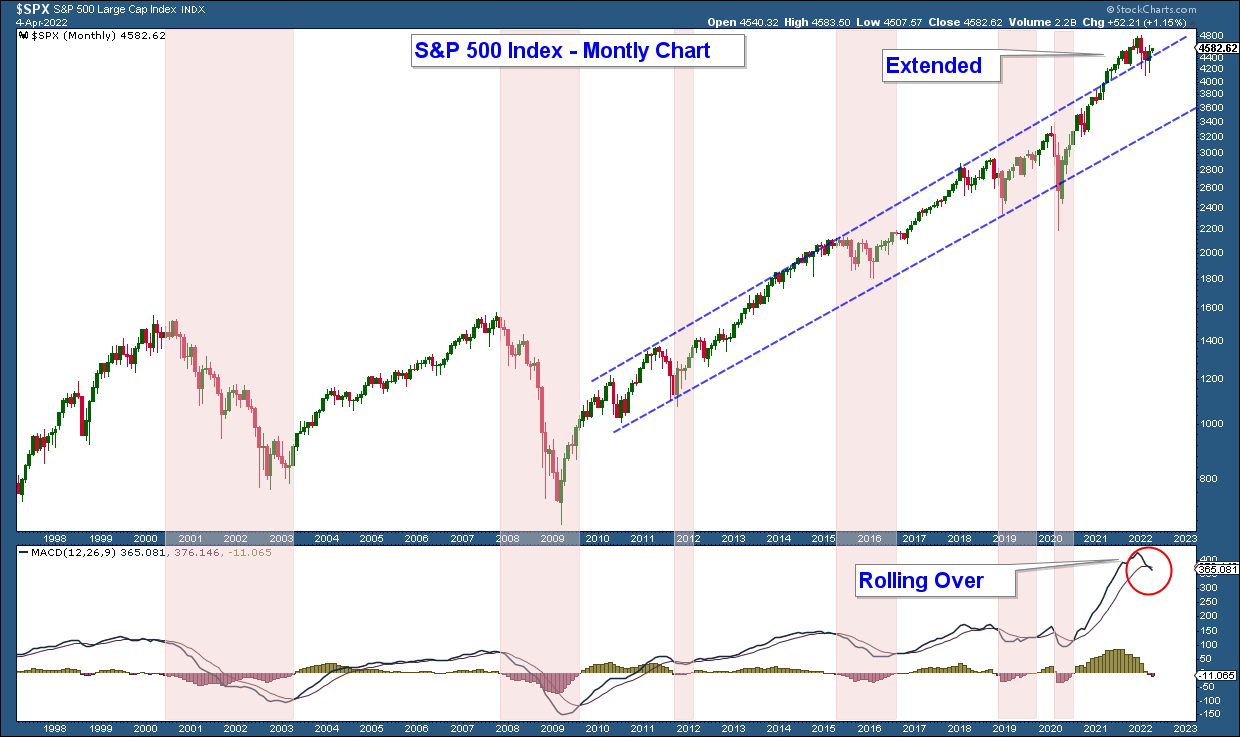
Let’s start by analyzing the market over a long-term basis by looking at a monthly chart of the S&P 500 (chart below). Here are my takeaways from this chart:
- The index is extended to the upside which is evident by the fact that the index is above the upper end of its price channel.
- Momentum has rolled over. The MACD in the lower panel has dropped below its moving average.
This chart is suggesting the odds of a longer-term market correction are elevated.
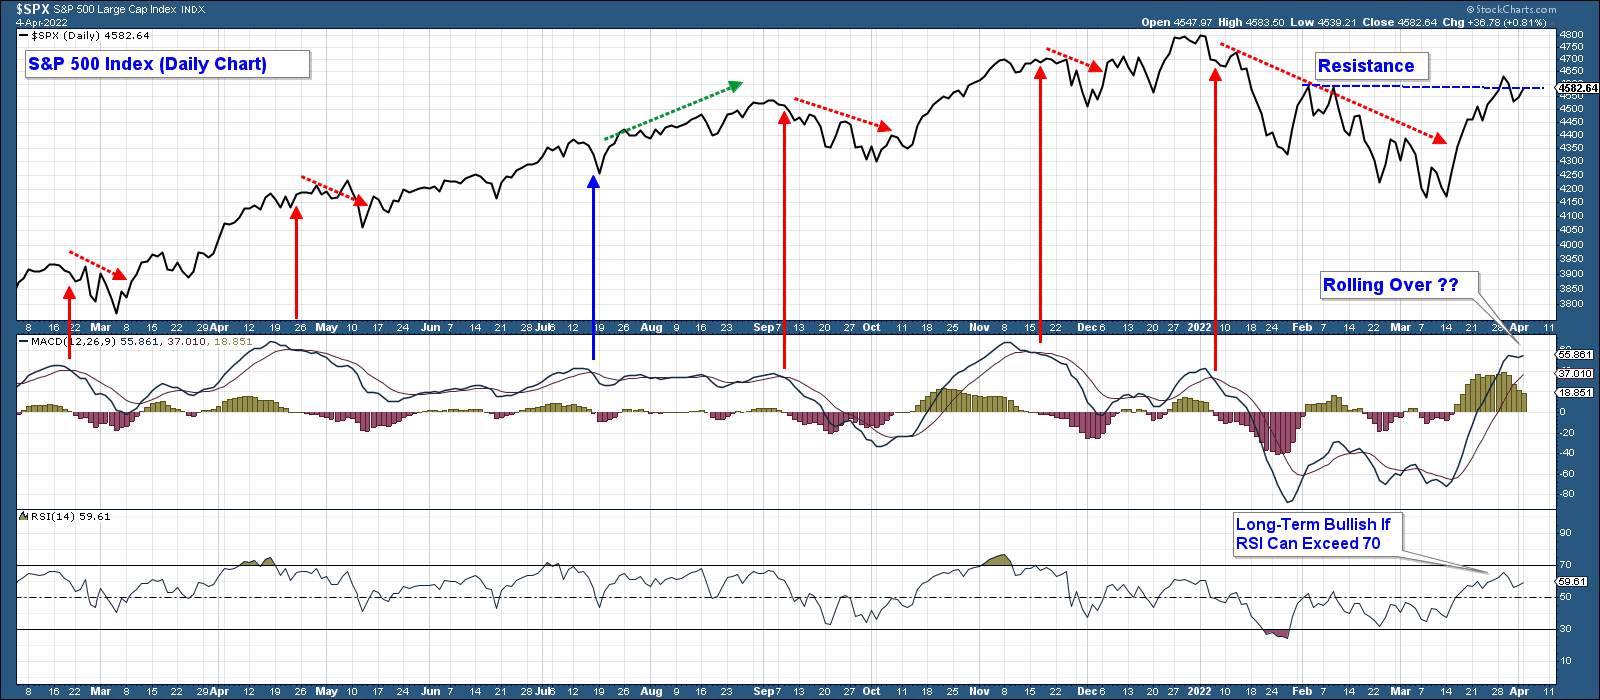
Now let’s narrow our focus and analyze a daily chart. Here are my takeaways from this chart:
- After a 13% decline peak-to-trough, the index has advanced into resistance retracing a good portion of the previous decline.
- Upward momentum has started to wane as can be seen by the MACD (momentum indicator) flattening out.
- The RSI (momentum indicator) in the lowest panel is sitting under 70. I have found 70 to be the dividing line between bullish and bearish market environments. Meaning during bearish environments RSI tends to top out under 70. And during bullish environments, it tends to exceed 70.
This chart is suggesting that while we have had a decent advance off the March lows, momentum is waning and the odds of short-term weakness has increased slightly. The degree to which price declines or advances from here will provide a clue as to the longer-term strength or weakness of the market. Meaning, that if the index can advance strongly above resistance it would have bullish implications for the broader market. Especially if that advance occurs on broadening, risk-on market breadth. On the other hand, if price falls strongly it would be extremely bearish considering that long-term the index is extended and momentum has decidedly rolled over.
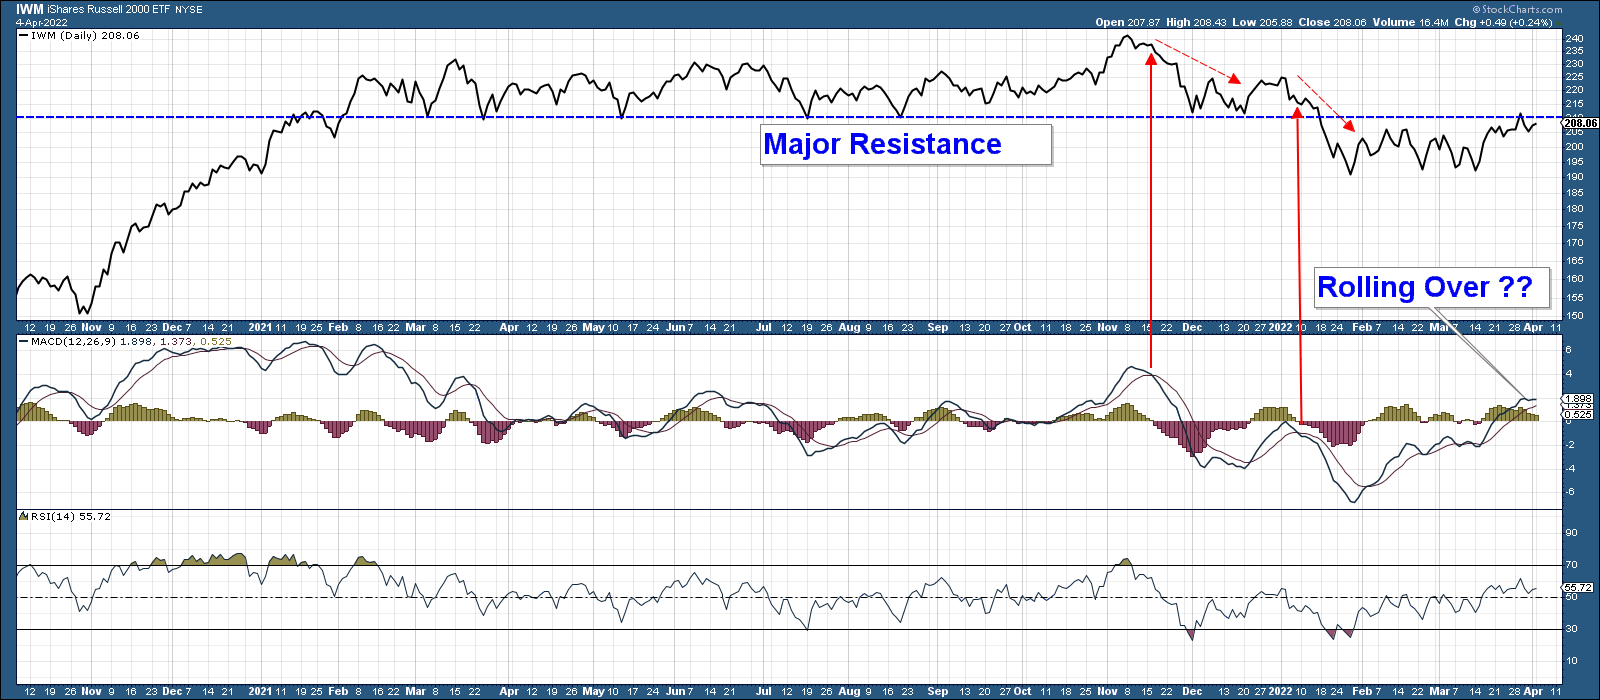
Now let’s look at a daily chart of the Russell 2000 Small-Cap Index ETF (IWM). This index displayed weakness early last year, far ahead of the S&P 500. After consolidating most of last year, it fell strongly below major support that had held for almost a year.
Like the S&P 500 Index, it too is losing momentum right under major resistance.
Summary
Major market indexes are at a crossroads. The recent advance is losing momentum and an acceleration to the downside would have bearish short and long-term implications for the broader stock market.
On the other hand, if these indexes can garner enough strength to strongly advance above last week’s highs it would be bullish. Especially if that advance occurs on broadening, risk-on market breadth.
In order to keep this update concise, I didn’t review market breadth nor look at which sectors and industry groups are outperforming. In summary, risk-off equities are much stronger than risk-on equities which suggest underlying weakness in the broader stock market.
I am hoping to publish a video soon where I take a deeper dive into these charts. When I do I will archive it to our website and YouTube page.
Client Account Update
The stock portion of our portfolio is invested in stronger segments of the market such as commodities, agriculture, metals & mining, utilities, insurance, REIT’s, country-specific international index funds, and gold.
These positions have been hedged with index short funds this year. I have increased/decreased the degree to which we have shorted the market based upon short-term strength/weakness.
After eliminating all of our short hedges over the recent market advance, we have gradually increased them over the past week given short-term market weakness. We will continue to adjust this hedge based on market conditions.
The bond portion of our portfolios is minimally invested given poor bond technicals.
As always, we monitor market conditions daily and look to protect our clients from losses during times of major stock and bond market stress.
If you have any questions, please feel free to send me an email.

Craig Thompson, ChFC
Email: [email protected]
Phone: 619-709-0066
Asset Solutions Advisory Services, Inc. is a Fee-Only Registered Investment Advisor specializing in helping the needs of retirees, those nearing retirement, and other investors with similar investment goals.
We are an “active” money manager that looks to generate steady long-term returns, while protecting clients from large losses during major market corrections.
Asset Solutions may discuss and display, charts, graphs, formulas which are not intended to be used by themselves to determine which securities to buy or sell, or when to buy or sell them. Such charts and graphs offer limited information and should not be used on their own to make investment decisions. Most data and charts are provided by www.stockcharts.com.
Asset Solutions is a registered investment adviser. Information presented is for educational purposes only and does not intend to make an offer or solicitation for the sale or purchase of any specific securities, investments, or investment strategies. Investments involve risk and unless otherwise stated, are not guaranteed. Be sure to first consult with a qualified financial adviser and/or tax professional before implementing any strategy discussed herein. Past performance is not indicative of future performance.