The Bottom Line
Bias:
Long-Term Positive for Stocks.
Positive for Treasury Prices and Other Interest Rate Sensitive Bonds.
- We are in a strong bull market. The recent consolidation in the market has been resolved to the upside which is bullish.
- Long-term the stock market still looks strong; therefore, any weakness in stocks that we see in the coming weeks should be viewed as a buying opportunity as long as the lows of early November are not violated.
- Yields look like they have hit a short-term top but have not started to decline yet. If they break support and begin to fall this would be positive for Treasury prices and other interest rate sensitive bond prices.
Client Update
A couple of our High Yield Bond Funds hit their stops and were sold. As a result, client accounts are about 65% – 80% invested.
I am looking to increase market exposure strategically.
Market Technicals
“Market internals still suggest long-term market strength; however, whichever metric you use, we are due for some type of short-term pullback. It does not make sense to try to anticipate a correction because in strong markets that is difficult.
The metrics that I will be monitoring to alert me that a short-term correction has begun are: price action, a strong advance in the VIX, a deterioration in market breadth, and falling momentum indicators. Any weakness that occurs should provide an opportunity to increase market exposure.
While we have seen some deterioration in market internals over the past week, they have not deteriorated to a level that would signal that a short-term correction has begun.”
Not much has changed with regards to my view on the market since our last newsletter. Therefore, instead of simply updating those charts and reiterating what I have said previously, I will discuss what I am monitoring to gain some clues as to the next short-term market move.
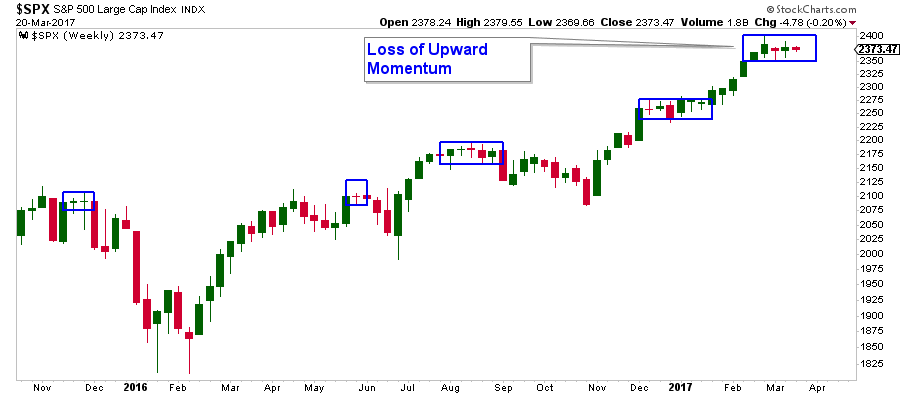
While long-term the stock market looks strong, short-term technicals have continued to deteriorate, but not to the point that has resulted in stocks gaining any downward momentum. Instead, they have leveled off over the past few weeks. This can be seen in the weekly chart (each bar contains a weeks’ worth of price action) of the S&P 500 below. Notice how upward momentum has leveled off. I have highlighted previous instances of similar consolidation and 3 out of the 4 preceded short-term corrections.
Below is a daily chart of the S&P 500 which is sitting right above support. If this level of support gets violated to the downside, the next level of support is about 4% – 5.6% below where it closed today.

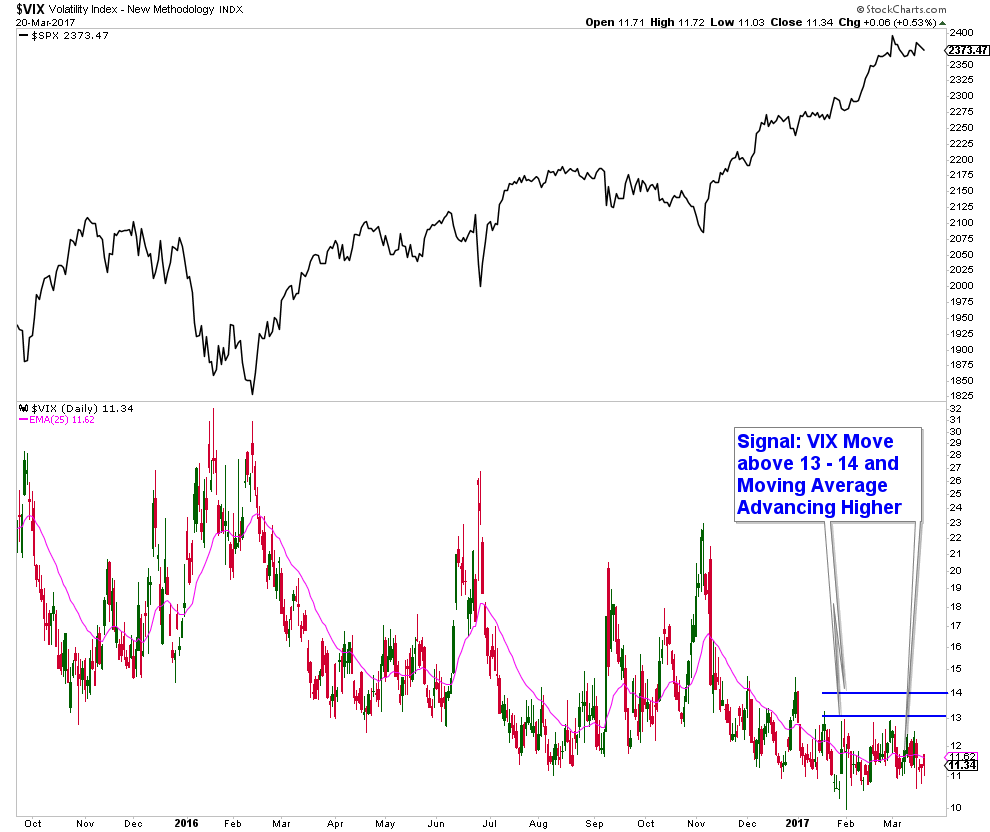
The main ingredient absent this market is investor fear, which can be measured using the VIX (commonly referred to as the fear index). Historically low VIX levels are common at market tops and high VIX readings are seen at market bottoms.
The VIX is currently bouncing around at very low levels which is a warning sign, not a sell signal. This is because the VIX can continue to reside at depressed levels for extended periods as stocks grind higher. Therefore, for stocks to gain any traction to the downside, I am looking for the VIX to advance above about the 13 – 14 level, and it’s moving average to start trending higher.
There are several Intermarket Relationships that are signaling short-term market weakness, two of which I am highlighting below.
First is a relative strength chart (bottom panel in the chart below) of the Transportation sector relative to Treasury Bonds. When Transportation is outperforming, as it should during market strength, the line is advancing. As you can see, after forming a wedge, it has broken to the downside signaling relative weakness in the Transportation sector which is bearish.
![]()
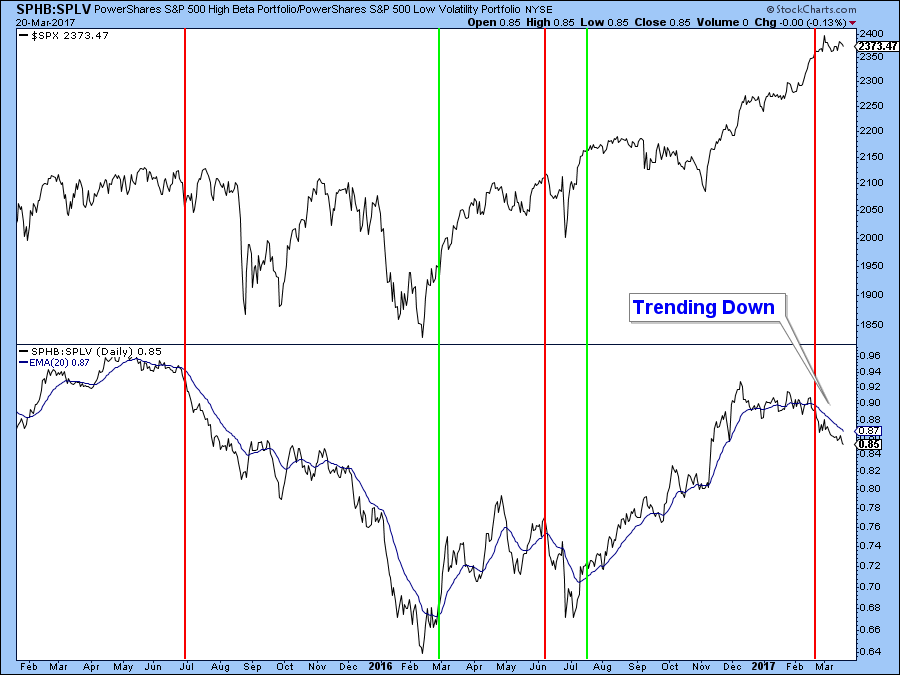
Next, I have a relative strength chart of the S&P 500 High Beta ETF versus the S&P 500 Low Beta ETF. During periods of market strength investors are more willing to take risk and thus High Beta stocks will typically outperform as they have until recently. As you will notice, the relative strength line has turned down.
As I have mentioned above, long-term the stock market is displaying strength; however, shorter-term internals continue to display weakness. Monitoring this weakness is important in that any pullback in stocks could provide us the opportunity to increase market exposure when stocks are better positioned to advance.
9 Things Dietitians Wish You Knew About High Cholesterol

If you have any questions, please feel free to contact me.

Craig Thompson, ChFC
Email: [email protected]
Phone: 619-709-0066
About Asset Solutions
Asset Solutions Advisory Services, Inc. is a Fee-Only Registered Investment Advisor specializing in helping the needs of retirees, those nearing retirement, and other investors with similar investment goals.
We are an “active” money manager that looks to generate steady long-term returns, while protecting clients from large losses during major market corrections.
Asset Solutions is a registered investment adviser. Information presented is for educational purposes only and does not intend to make an offer or solicitation for the sale or purchase of any specific securities, investments, or investment strategies. Investments involve risk and unless otherwise stated, are not guaranteed. Be sure to first consult with a qualified financial adviser and/or tax professional before implementing any strategy discussed herein. Past performance is not indicative of future performance.