Housekeeping
I write monthly newsletters that are posted on the first Monday of each month. In addition, I post periodic updates dependent on what is going on in the markets. I did not post any updates in January because I had my tech guy working on my web page and he instructed me not to add any new blogs until he had my site complete. The site is now complete, so I will be posting more in the coming months.
With the new year, I have been thinking about how I may be able to provide better content going forward. My thoughts are that most people would rather less technical charts and more basic summaries. If you feel differently or have suggestions as to how I can make my newsletter more beneficial please feel free to email me with your thoughts.
I am planning on doing periodic videos that will be uploaded to my YouTube channel. The content of these videos will vary and hopefully provide me a vehicle to teach investment strategies and concepts. For example, I may do a video on how I manage risk when buying a stock or why minimizing market losses is so important for those investors in or near retirement.
Market Update
Global stock markets ended 2018 with a loss. The S&P 500 was down over 6% and Vanguard All-World ETF lost over 14%.
The S&P 500 bounced almost 8% for the month of January 2019 and is up over 15% from the December lows. That is an impressive bounce, and begs the questions: Was that the bottom? Has market risk subsided? Have we transitioned out of a bear market and into a new bull market?
First, when I mention the term “bear market”, it is not a commentary on how far stocks have fallen or are projected to fall (the definition of a bear market is a drop of at least 20%, which the S&P 500 has fallen on an intraday basis). It is more a term I use to define long-term risk in the broad stock market. The way I define bear markets is that they are marked by extremely high broad stock market risk, and from a technical perspective, the market is in a down-trend and trading below its 200-day moving average.
When evaluating the stock market I like to first look at the market from a long-term perspective (monthly price chart), then narrow down my focus to a daily chart. First off, long-term trends are extremely important. Many bull and bear markets can be traced from beginning to end using a trendline. When that line is broken, it is a red flag that you are potentially looking at a major long-term change in trend. Cyclical bull markets tend to last for years and cyclical bear markets typically last months.
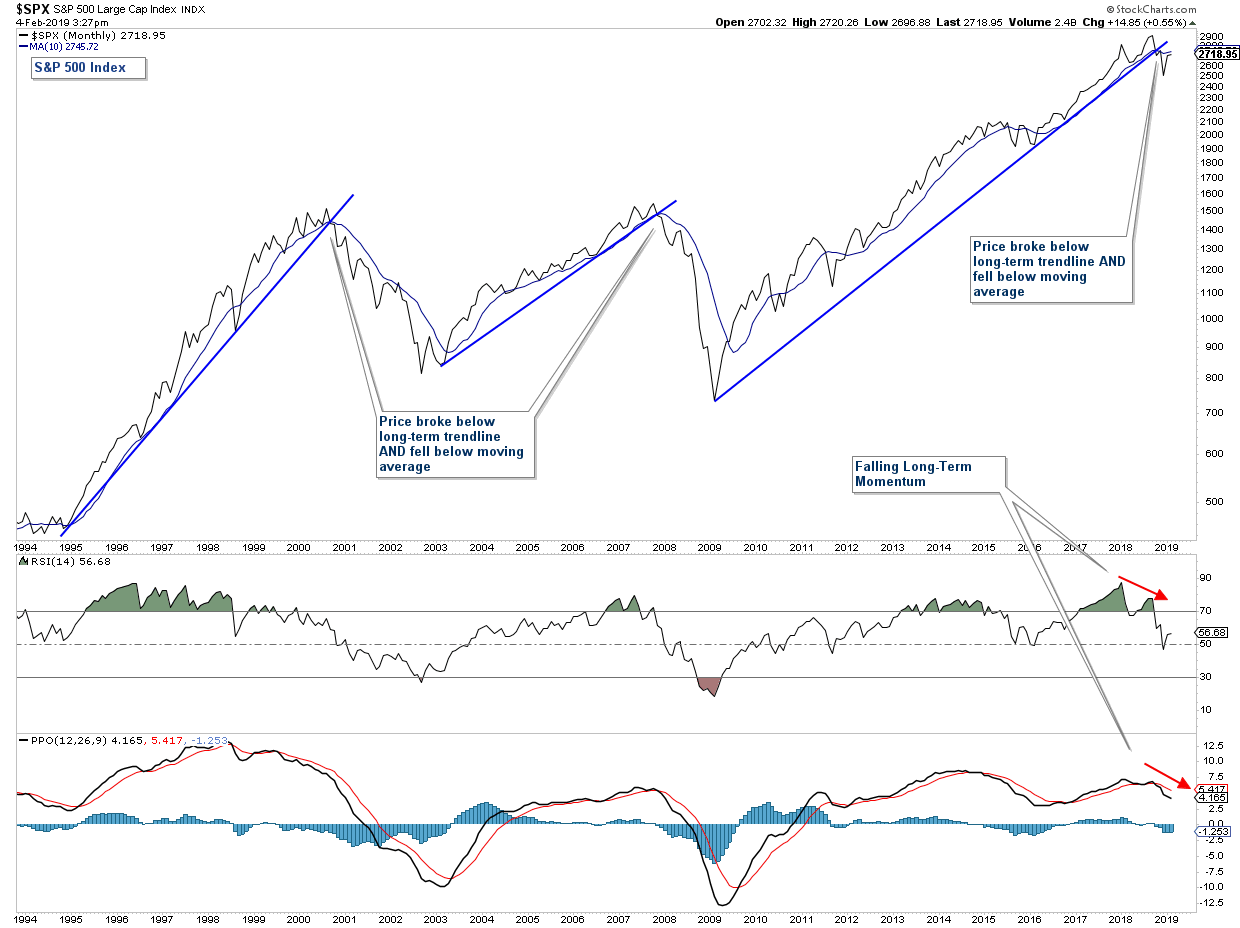
Below is a long-term chart of the S&P 500 (our proxy for the broader stock market). Here are the important aspects of the chart:
- The blue trendlines notate uptrends that when broken, have resulted in a major stock market drop or bear market. The index recently violated a trendline that has held since 2009.
- When the index is below its 10-month moving average, it is bearish. The index is currently below this moving average.
- Both momentum indicators are falling signaling that long-term momentum is negative.
Conclusion: From a long-term perspective, risk is high. We broke a long-term trendline to the downside, price is below its 10-month moving average, and long-term momentum is negative.
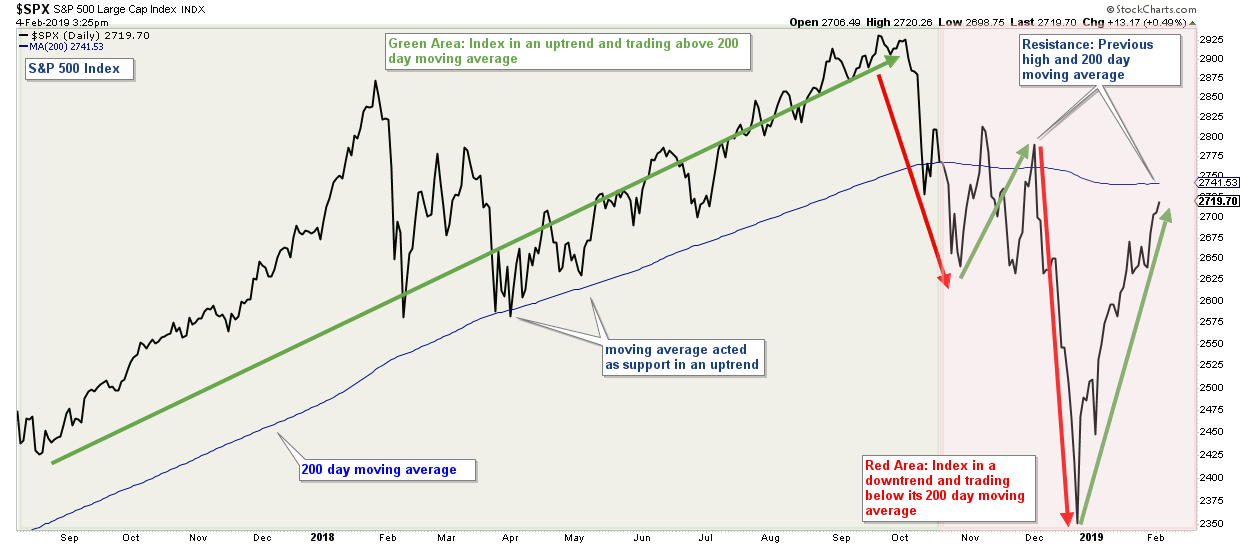
Now let’s look at a more narrowly focused chart. The chart below is a daily price chart of the S&P 500 covering the past year and a half. I have highlighted the chart in green where the index was displaying bullish characteristics and red where I consider it to be in a bearish environment. Here are the important aspects of this chart:
- During the bullish period (green area), the index made a series of higher highs and higher lows (the definition of an uptrend). In addition, its 200-day moving average acted as support as price traded above that average and that average trended higher with price.
- During the current bearish period (red area), price is in a downtrend as noted with the red and green arrows. Even though the recent bounce was impressive, it is still smaller than the preceding December drop. In addition, price is still below its 200-day moving average and that average is now flat. Both the highs of December and the 200-day moving average will act as resistance for the market going forward.
Conclusion: From a short-term perspective, the stock market is still in a primary bear market.
In conclusion, both from a long and short-term basis it looks like stock market risk is still elevated and the primary trend is still bearish.
If the market can advance above resistance (December highs & 200-day moving average), establish a higher high and higher low, and trade above its moving average, that would strongly suggest that a new bull market has emerged. However, at this point, you have to respect the trend and the trend is still down.
Client Account Update
I currently view stock market risk to be high and thus I have client accounts invested in interest rate sensitive bonds and gold.
Summary of How I Manage Client Accounts:
- I do not use a buy-and-hold approach like most financial advisors. I believe this strategy, while good for young investors, can have severe adverse consequences for those in or near retirement.
- I use technical analysis to manage risk and preserve principal during major stock/bond market corrections (Bear Markets).
- I have two basic models that I use to manage client accounts. One is conservative and appropriate for investors that are in or near retirement, and an aggressive model for younger more aggressive investors.
- I am a risk manager and will increase our risk level when risk in the market is low, and decrease our risk when risk in the market is high.
If you have any questions, or if you want me to review your retirement account allocations, please feel free to contact me.

Craig Thompson, ChFC
Email: [email protected]
Phone: 619-709-0066
Asset Solutions Advisory Services, Inc. is a Fee-Only Registered Investment Advisor specializing in helping the needs of retirees, those nearing retirement, and other investors with similar investment goals.
We are an “active” money manager that looks to generate steady long-term returns, while protecting clients from large losses during major market corrections.
Asset Solutions is a registered investment adviser. Information presented is for educational purposes only and does not intend to make an offer or solicitation for the sale or purchase of any specific securities, investments, or investment strategies. Investments involve risk and unless otherwise stated, are not guaranteed. Be sure to first consult with a qualified financial adviser and/or tax professional before implementing any strategy discussed herein. Past performance is not indicative of future performance.