Stock Market Update
I monitor market technicals to get insight into the strength and weaknesses of the stock market. For example, market breadth, inter-market analysis, and sentiment can help determine if the market may be due for a pause or pullback. However, the most useful tool that I have found is simply evaluating price.
The way a technician does this is by looking at a price chart and determining the trend of the market. Or if the market is trending, because sometimes markets don’t trend. The tools that are the most useful when looking at a chart are trendlines, support/resistance, and price channels. These tools can be used to define the trend and provide logical levels that would signal a change in trend.
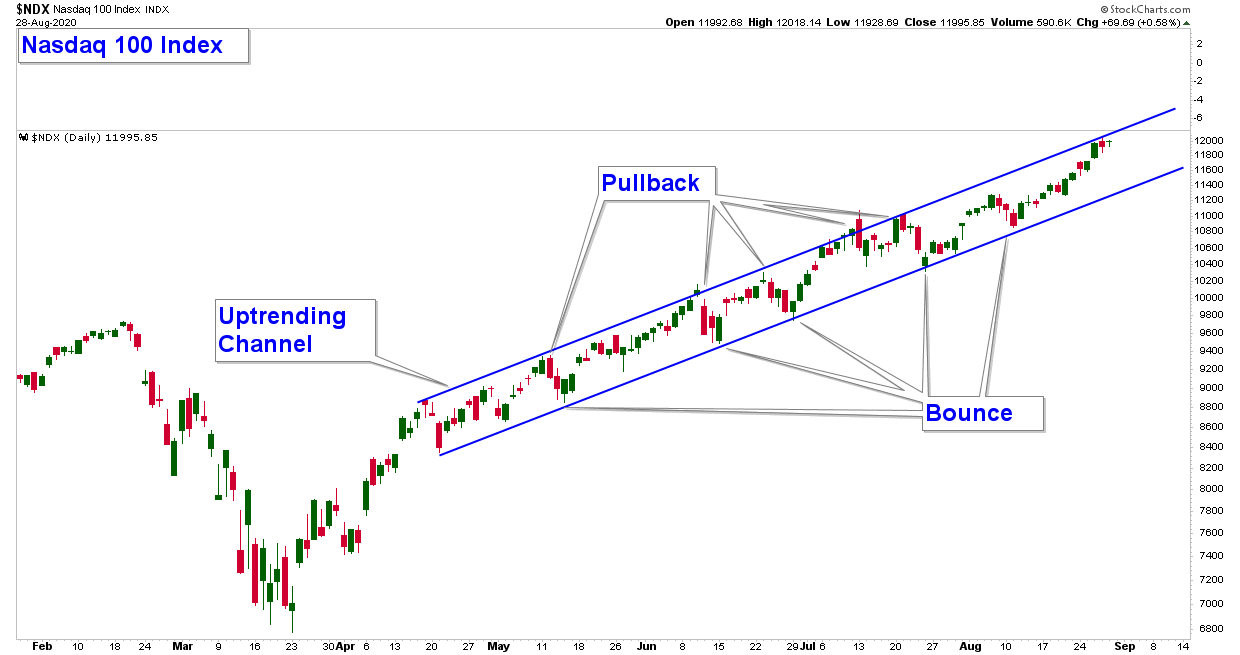
Currently, the market is trending and the index that is providing the best trending qualities is the Nasdaq 100. The Nasdaq 100 is made up of mainly technology companies and is the market index that is performing the best and leading the broader market higher.
As you can see below, this index is trending nicely within a narrow up-trending channel. The index is near the upper end of the channel, so I would not be surprised to see some short-term weakness in the coming days, but as long as the lower end of the channel does not get decisively violated to the downside, the trend is up and this suggests a bullish broader market thesis. At least from a price perspective.
Let’s enjoy the ride while it lasts.
If you have any questions, please feel free to shoot me an email.

Craig Thompson, ChFC
Email: [email protected]
Phone: 619-709-0066
Asset Solutions Advisory Services, Inc. is a Fee-Only Registered Investment Advisor specializing in helping the needs of retirees, those nearing retirement, and other investors with similar investment goals.
We are an “active” money manager that looks to generate steady long-term returns, while protecting clients from large losses during major market corrections.
Asset Solutions may discuss and display, charts, graphs, formulas which are not intended to be used by themselves to determine which securities to buy or sell, or when to buy or sell them. Such charts and graphs offer limited information and should not be used on their own to make investment decisions. Most data and charts are provided by www.stockcharts.com.
Asset Solutions is a registered investment adviser. Information presented is for educational purposes only and does not intend to make an offer or solicitation for the sale or purchase of any specific securities, investments, or investment strategies. Investments involve risk and unless otherwise stated, are not guaranteed. Be sure to first consult with a qualified financial adviser and/or tax professional before implementing any strategy discussed herein. Past performance is not indicative of future performance.
All charts provided by: StockCharts.com