New Web Page
I have consolidated our blog and web page into one comprehensive site. My most recent newsletters have not been added yet, but that will be done this week. Please feel free to check it out:

Stock Market Update
As I mentioned in a previous newsletter, I believe we are in stage 4 of the business cycle, which is bullish for stocks and commodities, but bearish for bonds. When we progress to stage 5, stocks enter a bear market (fall by more than 20%). This is why we have to be vigilant in monitoring market technicals. We don’t want to get caught holding stocks as they enter a bear market.
I recently wrote an Ebook on this topic. If you want a copy, shoot me an email and I will send it to you.
The S&P 500 started the new year with a flurry, advancing 5.6% in January. This advance is what technicians call a parabolic move. Parabolic moves cannot be sustained and as a result, prices need to be reset before they can begin a new uptrend.
February saw the market fall about 10% over only two weeks. It is my belief that this is just the stock market resetting, not something more ominous. This was a shock to many investors since 2017 was a year of high stock market returns with little volatility.
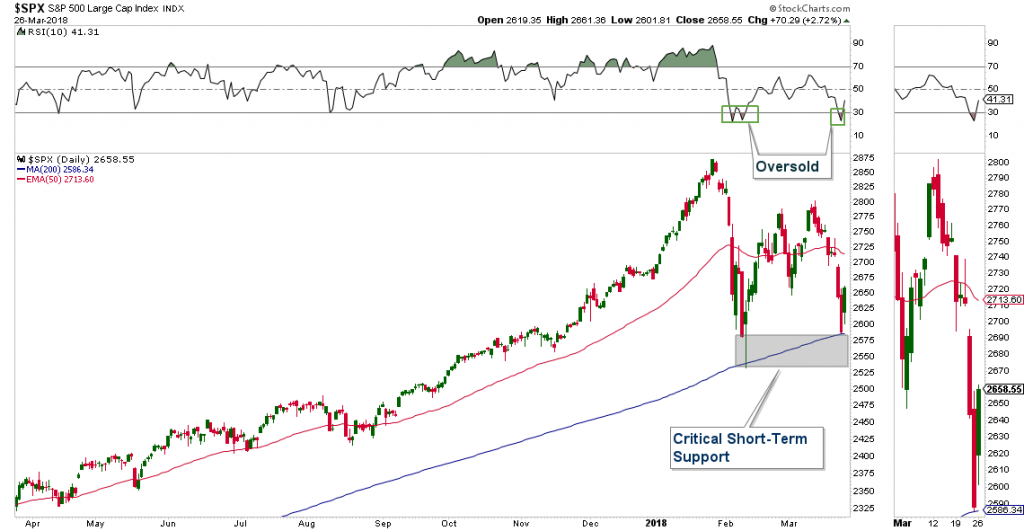
In the chart of the S&P 500 below, you can see that the market has now bounced twice right at its 200-day moving average, which historically has acted as support. If the market is now going to advance out of correction mode, and back into a sustainable advance, it must not fall decisively below this level of support. Acting as support for this area is the February low, 200-day moving average, and a two year trend-line (not shown).
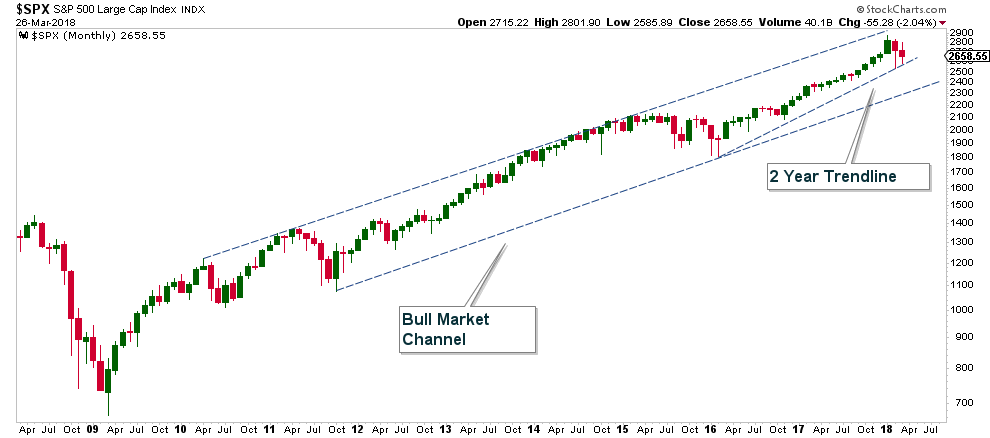
If we step back and look at the S&P 500 from a more long-term perspective, you will see that the markets recent weakness does not look all that dire. First, the market is still in a channel that has contained price since we entered the current bull market back in 2009. In addition, price is still above the uptrend line that was established at the beginning of 2016.
I believe that technical analysis is the most effective way to manage risk in the financial markets, but there is no one indicator that will work 100% of the time. Therefore, I adhere to a weight of the evidence approach and monitor what the majority of the indicators are suggesting about the market. When most of them are suggesting that risk is high and the odds of a major market correction are elevated, I move to cash. Even with the recent rise in volatility, I don’t see these type of warning signs. In fact, I see the opposite.
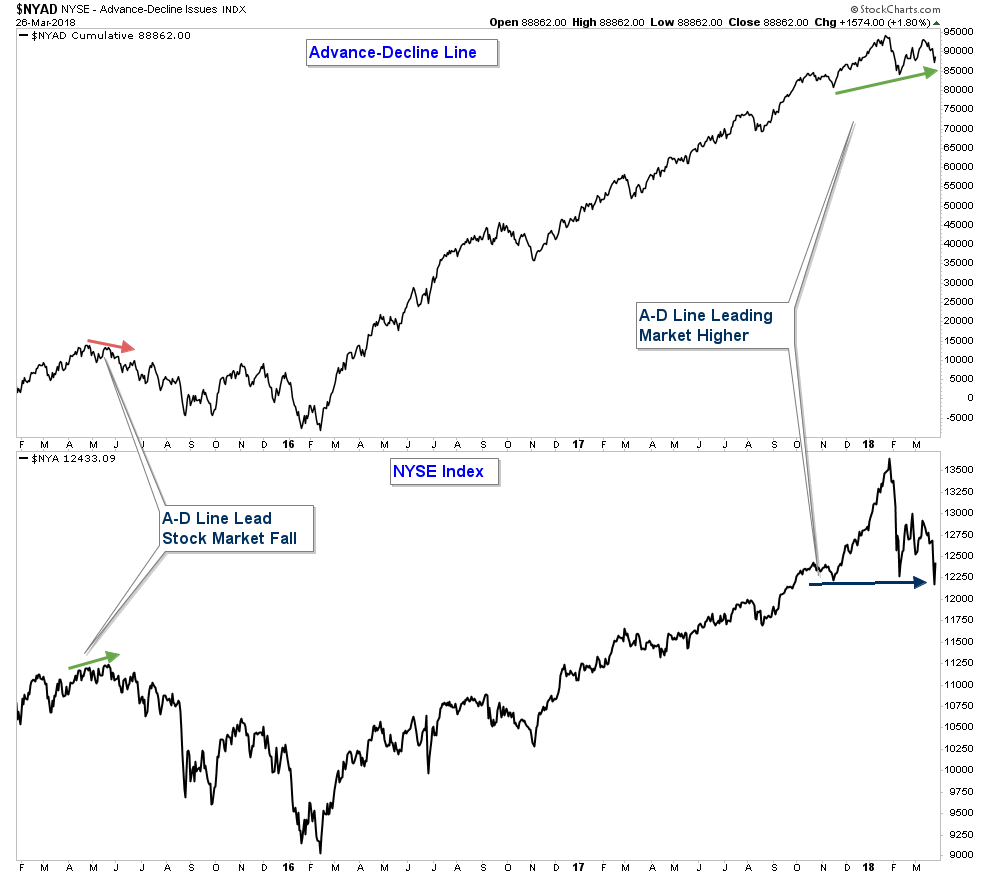
One of the more basic market breadth indicators is the Advance-Decline Line, which is a running total of the number of stocks advancing minus falling. It is useful, in that historically it has fallen prior to most major stock market corrections. Therefore, if we were entering a new bear market, we would have probably seen this line fall prior to the stock markets February drop. If you look at the chart below you will see that we are seeing the opposite. The Advance-Decline Line is actually showing strength, trending higher as the stock market moves sideways.
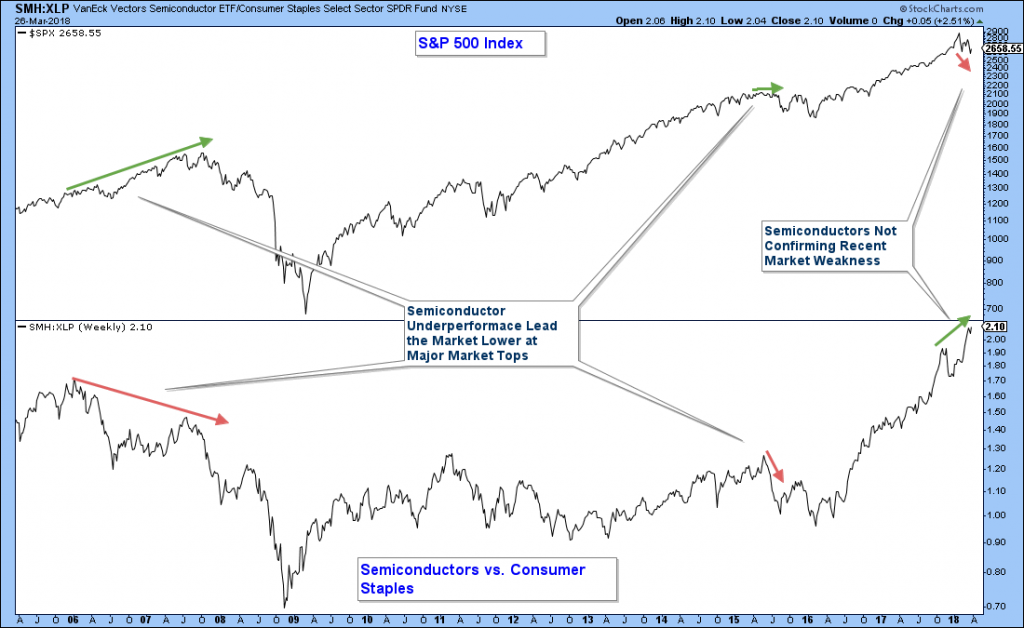
Investors continue to display a propensity to take on risk which is bullish for the entire stock market. Below is a chart of the relative strength of the market leading Semiconductor Industry ETF (SMH) versus a Consumer Staples ETF (XLP). When the line in the lower panel is rising, it indicates that the Semiconductor ETF (risk-on asset) is outperforming the Staples ETF (risk-off asset). This chart has historically been very useful in determining market weakness prior to the major averages falling into a major market correction.
Notice how we saw the Semiconductor ETF under-perform prior to the Bear market of 2008 and the market correction in 2015. We are not seeing similar weakness in this market leading industry this year. In fact, it is hitting new highs as the market has corrected recently. This is bullish for the broader market.
While the short-term weakness in the market is something to monitor. The weight of the evidence continues to suggests that we are not entering a bear market “yet”.
Anyone interested in having me evaluate their retirement account allocation, I have one slot open for the month of April. If interested, shoot me an email.
The Bottom Line
Bias:
Positive for Stocks and Commodity Prices
Negative for Interest Rate Sensitive Bonds
• Even though the stock market fell 10% earlier this month, we are still in a bull market.
• When the S&P 500 is hitting all-time highs, international markets are advancing strongly, and market breadth is positive – there is no other way to view the market other than positive!
• Interest rate sensitive bonds are falling and could be transitioning into a long-term bear market.
• Long-term, the weight of the evidence continues to be bullish for stocks. At some point, this will change and when it does, I will have no problem flipping to a bearish bias and reallocating client accounts to a more defensive posture. However, market technicals continue to signal that we are in a bull market and thus we should be invested in stocks aggressively.
Client Update
I continue to view stock market risk as low, thus our accounts have high stock market exposure.
I have continued to add to our equity holdings by buying stocks and stock funds that have pulled back and are in long-term up-trends.
We do not hold any interest rate sensitive bond funds.

Craig Thompson, ChFC
Email: [email protected]
Phone: 619-709-0066
Asset Solutions Advisory Services, Inc. is a Fee-Only Registered Investment Advisor specializing in helping the needs of retirees, those nearing retirement, and other investors with similar investment goals.
We are an “active” money manager that looks to generate steady long-term returns, while protecting clients from large losses during major market corrections.
Asset Solutions is a registered investment adviser. Information presented is for educational purposes only and does not intend to make an offer or solicitation for the sale or purchase of any specific securities, investments, or investment strategies. Investments involve risk and unless otherwise stated, are not guaranteed. Be sure to first consult with a qualified financial adviser and/or tax professional before implementing any strategy discussed herein. Past performance is not indicative of future performance.