Deteriorating Technials
Market Update
Like I mentioned in a past newsletter, these updates tend to be very technical and for those of you that just want to get a general feel for how much risk is in the market can drop down to the section below titled: The Bottom Line and Client Update.
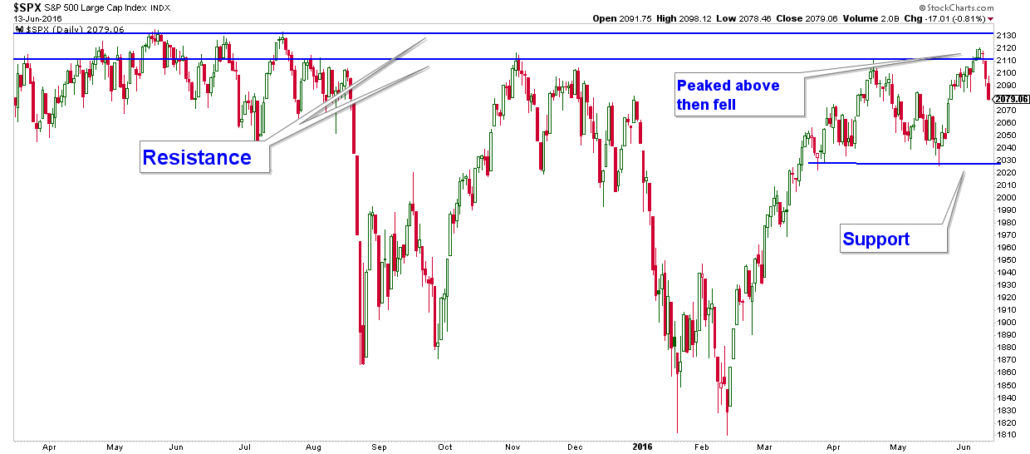
Stock market internals have deteriorated this past week from being mostly positive the week prior. Stocks inched above one layer of resistance last week then fell strongly (see chart below). I noted that this area of resistance is a huge test for the market given stocks have hit this level numerous times over the past year and each time failed to advance above it. If stocks are going to muster an advance above resistance, they need to stay above the lows of the past couple of months (support). If they fall below this level, that would complete a topping pattern that would suggest much lower stock prices.

I have not shown a Volatility Index chart in a while because it has been bumping around at pretty low levels. However, this week it shot up strongly above its 50-day moving average line. Fear has crept back into the market and investors are now becoming increasingly more apt to sell.
Below is a chart of the VIX with the S&P 500 in the lower panel. I have shaded those areas where the VIX was decisively below its 50-day moving average in green and above it in red. Notice how, for the most part, the market has been up when it is green and down when it is red.

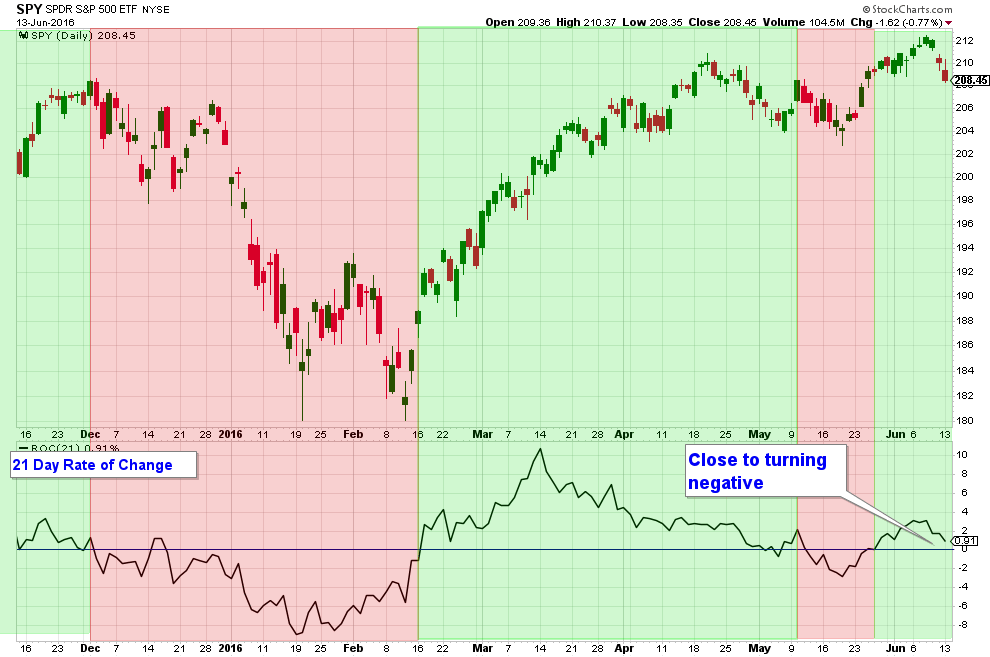
Stock market momentum is still positive, but is very close to going negative. Below is the same chart that I have been showing for the past few weeks, with the S&P 500 in the top panel and the 21-Day Rate of Change in the lower panel.
Notice how the 21-Day Rate of Change line (in the lower panel) is close to crossing the zero line and going negative.

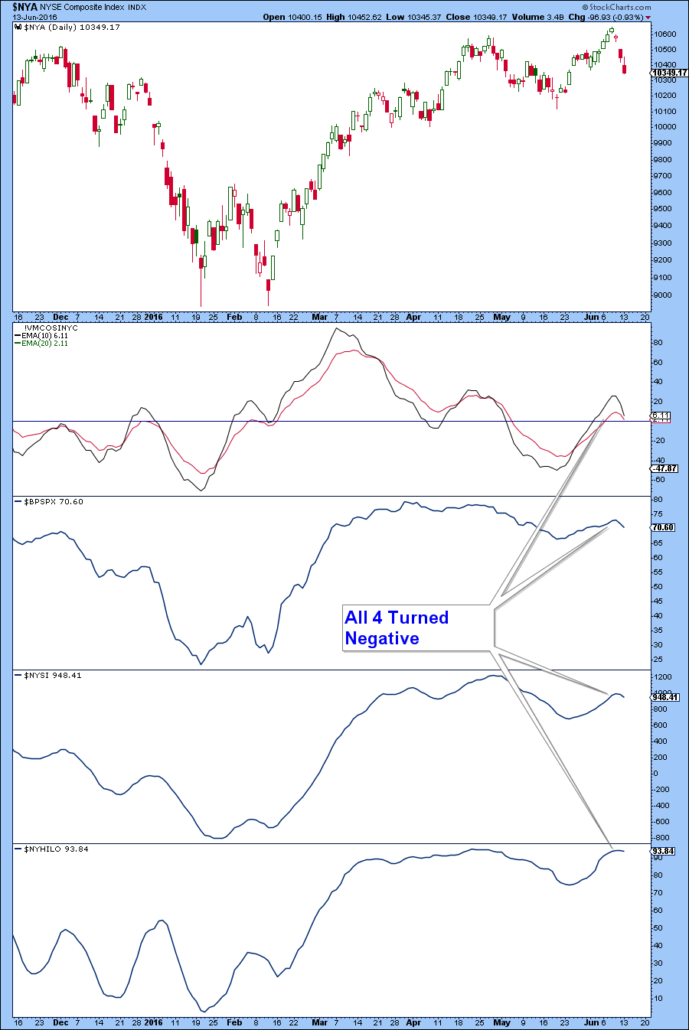
Stock market breadth has turned negative this past week. Below is the same chart I have shown in past weeks, with the exception of last week. The top panel is the S&P 500 and the lower four panels are four different breadth indicators and they all have turned down, which is a signal that stocks are under selling pressure.

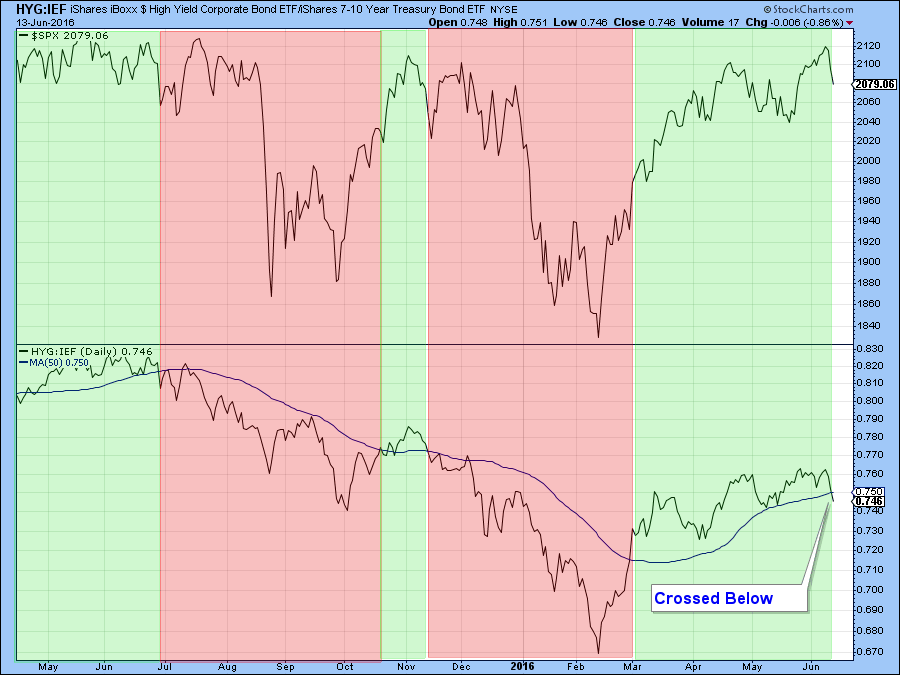
Below is a chart that I monitor, but have never posted in a newsletter. It charts the relationship between Junk Bonds and Treasury Bonds. The top panel is a chart of the S&P 500 and the lower panel is the relationship between Junk Bonds and Treasury Bonds.
A rising relationship means Junk Bonds are performing better than Treasury Bonds. This would mean investors are confident because they are more inclined to go for a high risk yield than the relative safety of treasuries. By the same token a declining ratio indicates fear among bond investors as they favor treasuries. I like to use a 50-day moving average cross-over as an indicator. A move below the moving average indicates a warning of stock market weakness and a cross above stock market strength.
As you can see in the chart below, the line just dropped below the moving average which raises a red flag for stocks.

The Bottom Line
Bias: Slightly Negative for stocks
My stock market bias has changed this week from positive to slightly negative based upon market internals that have deteriorated this past week. Overall the pullback we have seen in stocks over the past few days is minor, but stock market internals have deteriorated and this warrants caution. If you are retired or close to retirement, managing risk is of paramount importance!
Client Update
Client accounts are fully invested in mostly lower volatility bond funds, including: High Yield Municipal Bond Funds, Floating Rate Funds, Preferred Security Funds, High Yield Funds, and a small Equity Holding. For the most part, our accounts have trended up with very minor volatility.
I will probably make some small changes if market internals do not improve soon.

Craig Thompson, ChFC
Email: [email protected]
Phone: 619-709-0066
About Asset Solutions
Asset Solutions Advisory Services, Inc. is a Fee-Only Registered Investment Advisor specializing in helping the needs of retirees, those nearing retirement, and other investors with similar investment goals.
We are an “active” money manager that looks to generate steady long-term returns, while protecting clients from large losses during major market corrections.
