The Bottom Line
Bias:
Long-Term Positive and Short-Term Positive for Stocks.
• Long-term, stocks are in an uptrend and we are in a bull market.
• When the S&P 500 is hitting all-time highs, international markets are advancing strongly, and market breadth is positive – there is no other way to view the market other than positive
Client Update
Client accounts are fully invested.
Market Technicals
Stock Market Price Action
Positive Long-Term
Positive Short-Term
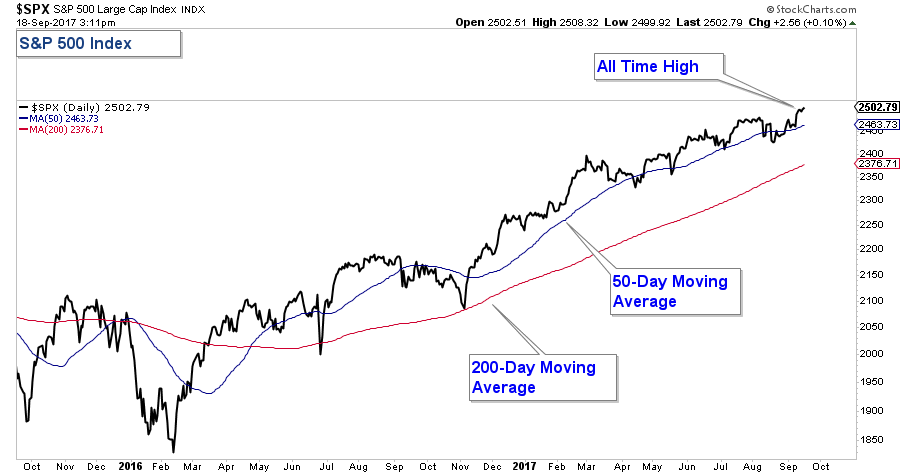
As I write this, the S&P 500 is hitting a new all-time high. In addition, price is above its 200-day moving average, its 50-day moving average, and both those averages are trending higher. Price action is the most important thing to look at when analyzing the market, and price action is emphatically positive.
Stock Market Breadth – Positive
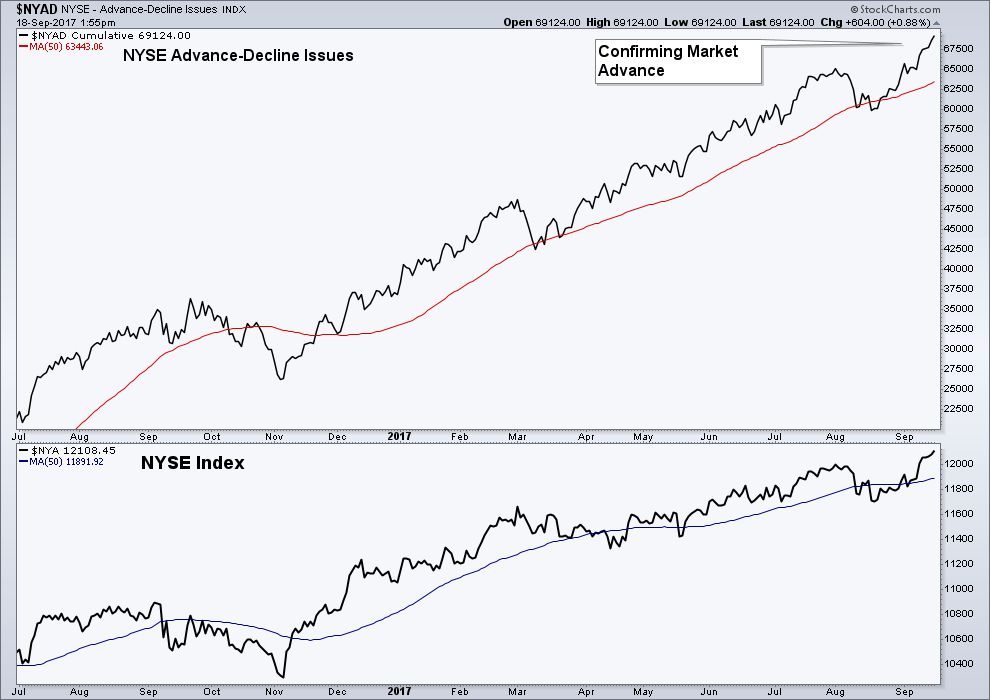
The current market advance is being confirmed by positive stock market breadth. Below is a chart of the NYSE Advance-Decline Line in the top panel and the NYSE Index in the lower panel. As you will notice the advance-decline line is also advancing strongly and hitting new highs which confirms the stock markets advance.
We are in a global market environment. All markets are interconnected and correlated to a large degree. Our market goes up and down based on the collective money flow from investors all over the world. Therefore, understanding what is happening globally is essential to recognizing what is happening within the United States.
In my August 28, 2017 Newsletter, stocks were in the process of pulling back on a short-term basis and I wrote about how I was watching the Semiconductor Index and the German DAX Index for clues as to the underlying strength in our stock market. Both those indexes, as well as the S&P 500, broke-out to the upside extending the long-term uptrend that we are seeing not only in the US, but globally.
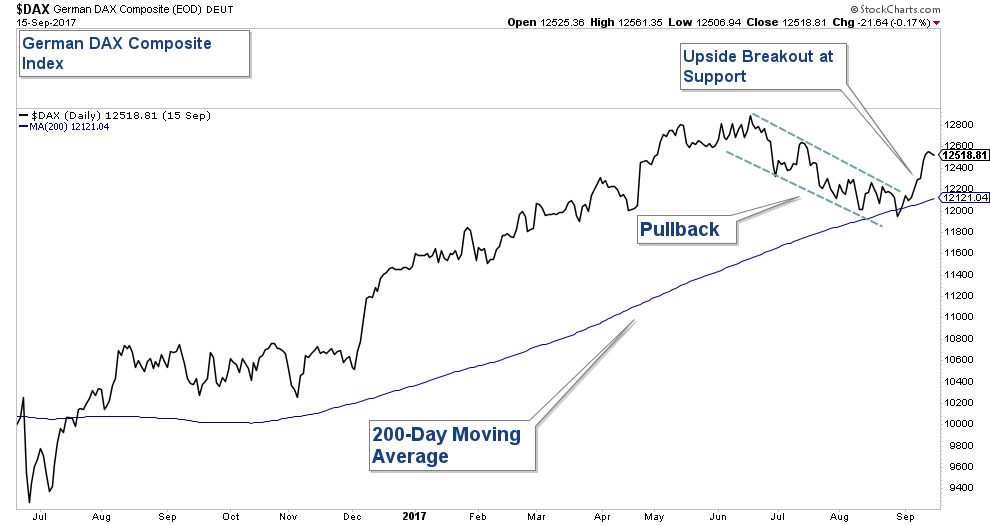
Below is a chart of the German DAX Index which is positively correlated to the US Market as well as being one of the most important global stock markets. Notice how it has broken out to the upside, right at its 200-day moving average. The strength that we are seeing not only in the German DAX, but most International Indexes continues to suggest we are in the midst of a strong global bull market.
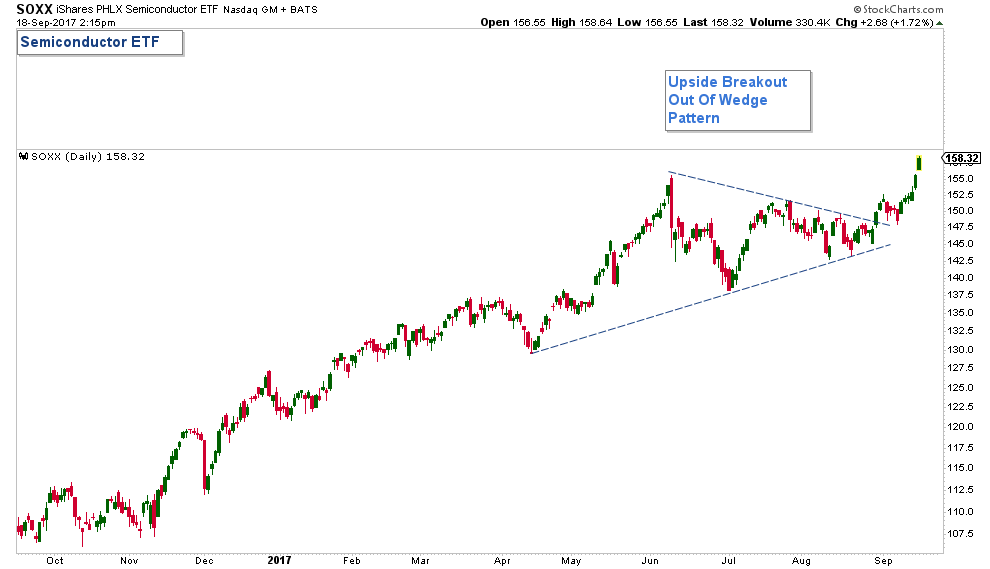
Below is a chart of SOXX (Semiconductor Index ETF). It has broken-out strongly to the upside from a wedge pattern. Since the Semiconductor Index is a market leader, its current advance is signaling strength for the broader stock market.
The weight of the evidence continues to be bullish for stocks. At some point, this will change and when it does, I will have no problem flipping to a bearish bias and reallocating client accounts to a more defensive posture. However, market technicals continue to signal that we are in a bull market and thus we should be invested in stocks.
If you have any questions, please feel free to contact me.

Craig Thompson, ChFC
Email: [email protected]
Phone: 619-709-0066
Asset Solutions Advisory Services, Inc. is a Fee-Only Registered Investment Advisor specializing in helping the needs of retirees, those nearing retirement, and other investors with similar investment goals.
We are an “active” money manager that looks to generate steady long-term returns, while protecting clients from large losses during major market corrections.
Asset Solutions is a registered investment adviser. Information presented is for educational purposes only and does not intend to make an offer or solicitation for the sale or purchase of any specific securities, investments, or investment strategies. Investments involve risk and unless otherwise stated, are not guaranteed. Be sure to first consult with a qualified financial adviser and/or tax professional before implementing any strategy discussed herein. Past performance is not indicative of future performance.