Bear Tracks , I have been working under the assumption that we are in a bear market. That assumption comes into play when evaluating the sectors to invest in, how oversold the market needs to get before it potentially bounces, and how aggressive I will be with our investment holdings.
In my December 7th Newsletter, Dark Clouds On The Horizon, I highlighted how the VIX (Click her for a VIX explanation) rose steadily over the past 1.5 years, just as it did before the last bear market. I viewed this as a warning sign that even though stocks were not falling they were possibly transitioning into a period where steep declines were coming. Today I want to highlight a second chart that also shows striking similarities to the last bear market. Below is a chart of the NYSE Summation Index (a market breadth indicator). For a detailed explanation of this indicator Click here.
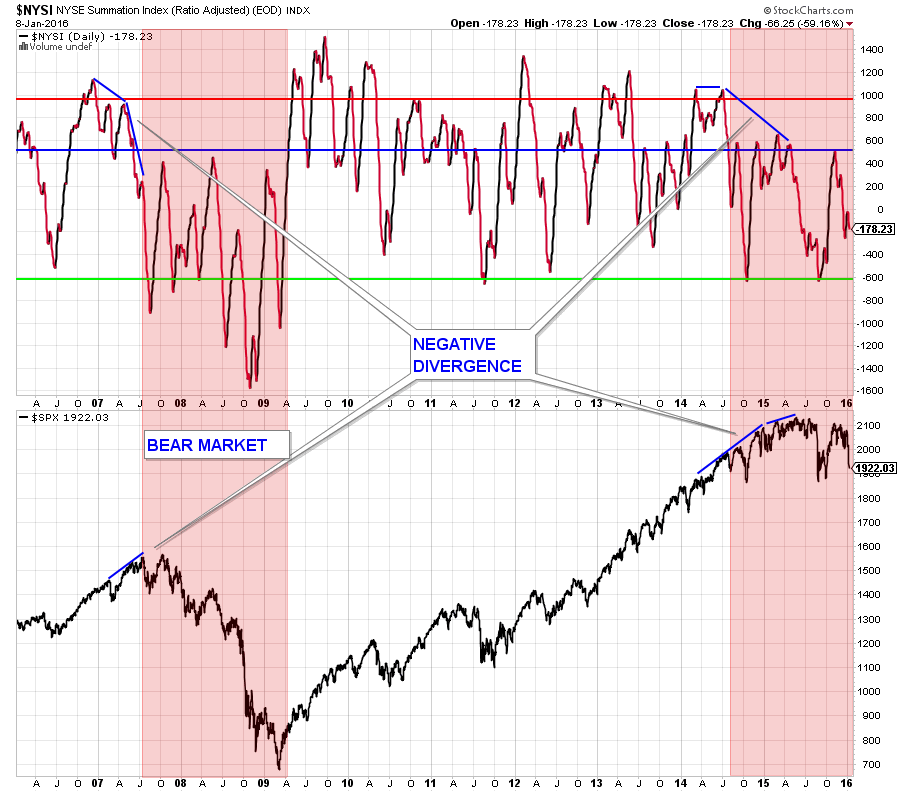
In the chart above, the shaded area highlights the last bear market and the past 1.5 years for comparison purposes. There are two similar characteristics to notice.
One, the negative divergence that occurred prior to stocks falling. Notice how in the last bear market the NYSE Summation Index was trending down as stocks continued to trend up. This same divergence occurred over the months prior to the steep market drop last summer.
Two, notice how the NYSE Summation Index was not able to advance above the 500 level (the blue line) during the last bear market just as it has been doing for the past 1.5 years.
Stock market indexes can rise while the number of stocks participating in those rallies deteriorates. This happens because many indexes are capitalization weighted and a small number of stocks can have a disproportionate influence on the index. However, when this happens it is usually a red flag and a signal of deteriorating market conditions.
Market Update
Steep losses this week marked the worst start to a new year for the S&P 500 and Dow Jones Industrial Average in history.
The S&P 500 lost 5.96% over the first five sessions of the New Year, closing at 1,922 on Friday.
Chinese stocks fell more than 11% over the first four trading days of the year and trading was halted twice after they triggered circuit breakers that automatically halted trade once the index fell 7%. Read about it here: China Stocks: Trading Called Off for Second Time This Week.
The first week of the new year was very eventful from a technical perspective. At this point I am looking for signs of a short-term market bottom. Short-term, because during bear markets the bounce you get from oversold conditions are muted.
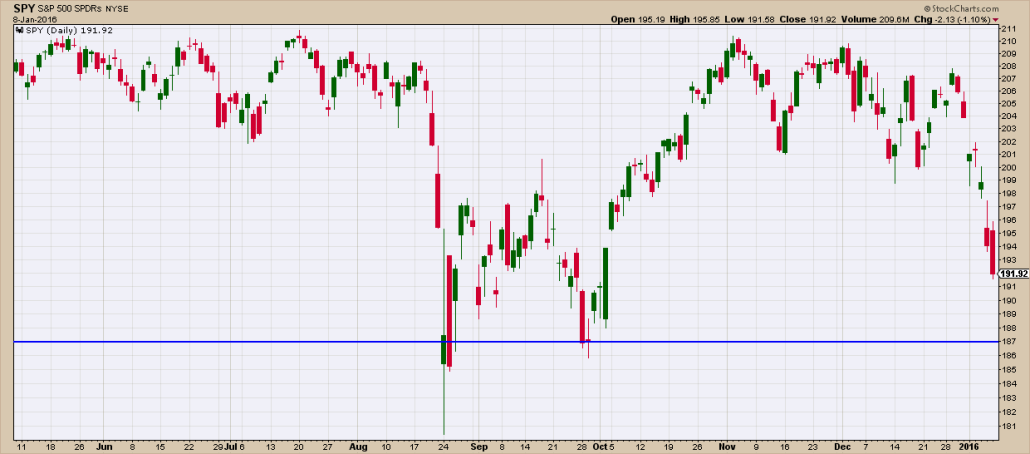
Below is a chart of the S&P 500 and the next level of support are the lows of last summer which are only 2.09% away.
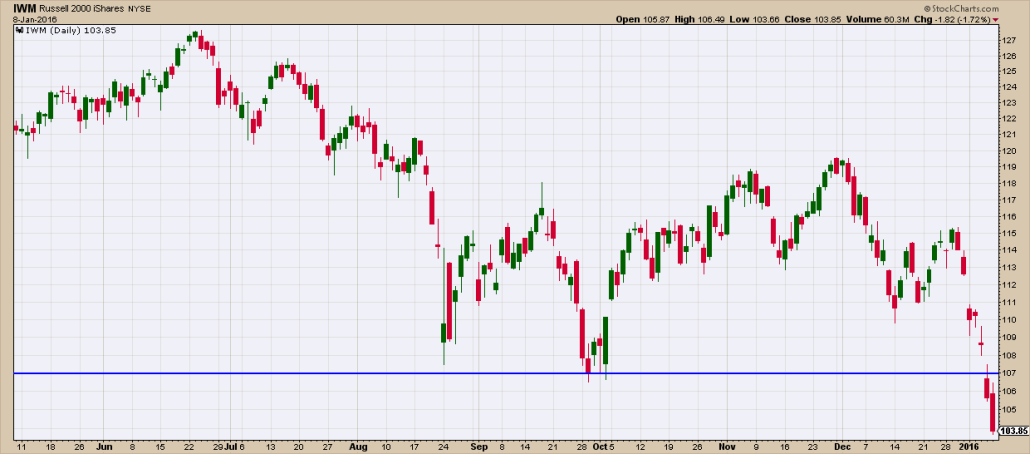
One sign that the S&P 500 will eventually fall below support is the fact that the Russell 2000 took out those levels decisively this past week.
Below is a chart of IWM (a Russell 2000 ETF).
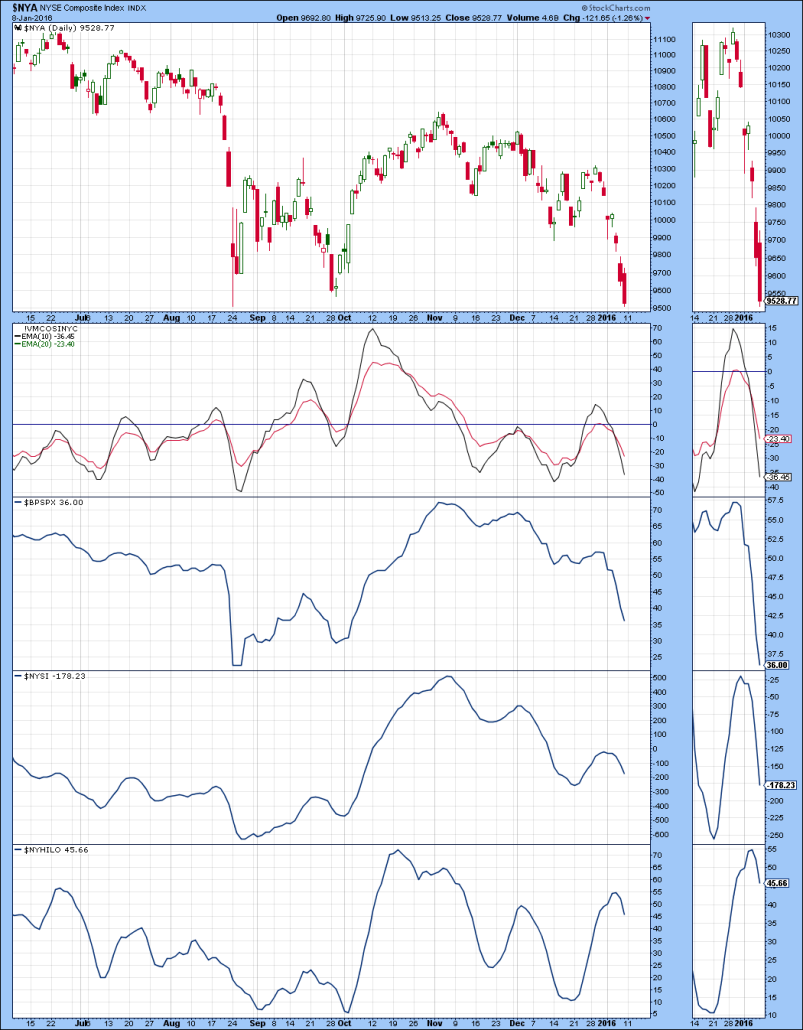
 Currently all four market breadth indicators that I monitor daily are trending decisively down. The stock chart at the top is the NYSE Composite Index, which is a broad index. Notice how it has also broken below support.
 At some point stocks are going to become oversold enough to form a bottom. That bottom may end up being a short-term bottom in a longer-term downtrend. So any trade made needs to be taken with a logical stop in place. Risk management is paramount in a down-trending market.
Client Update
I am extremely excited about the opportunities that a market correction could provide. At this point, I am keeping my powder dry and waiting for a good risk-adjusted return opportunity.
Aggressive accounts are 100% invested in a Money Market Fund.
Conservative accounts are 30% invested in High Yield Municipal Bond Funds and 70% in a Money Market Fund.

Craig Thompson, ChFC
Email: [email protected]
Phone: 619-709-0066
About Asset Solutions
Asset Solutions Advisory Services, Inc. is a Fee-Only Registered Investment Advisor specializing in helping the needs of retirees, those nearing retirement, and other investors with similar investment goals.
We are an “active” money manager that looks to generate steady long-term returns, while protecting clients from large losses during major market corrections.