Bear markets don’t historically end after only four weeks. Dropping dramatically then advancing back to new all-time highs for a “V” shaped recovery.
That is not to say that we should rule that scenario out. It is just that I believe that is a very low odds outcome based on what I am seeing in market technicals and how bear markets of the past have played out.
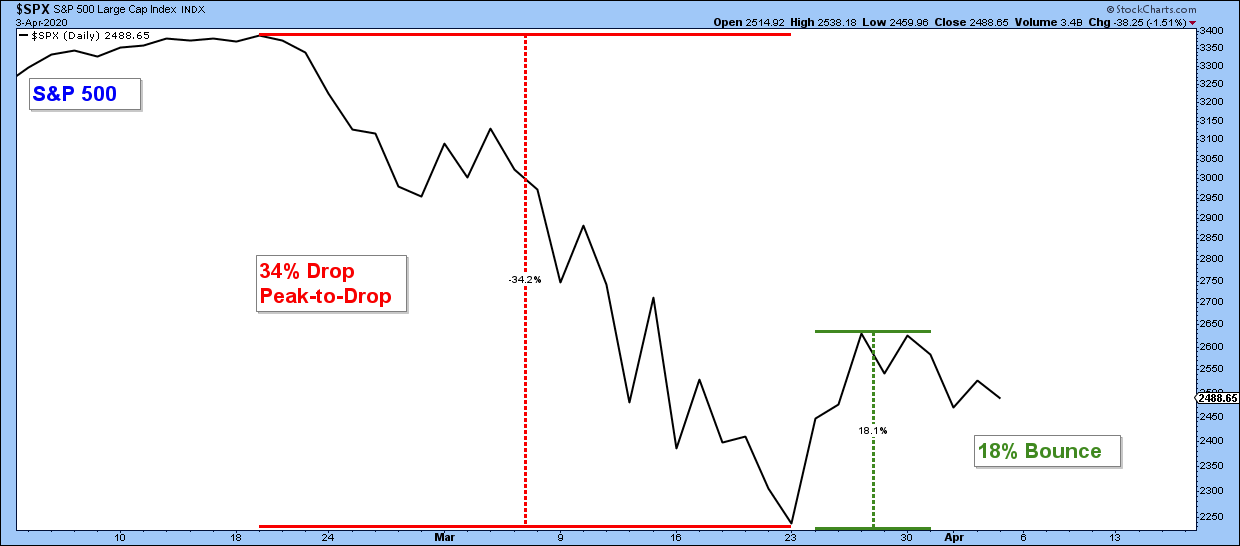
Below is a chart of the S&P 500 that shows the current bear market. We are less than 7 weeks into this bear market, which by historic standards, is the early innings of what could be a long, drawn-out process.
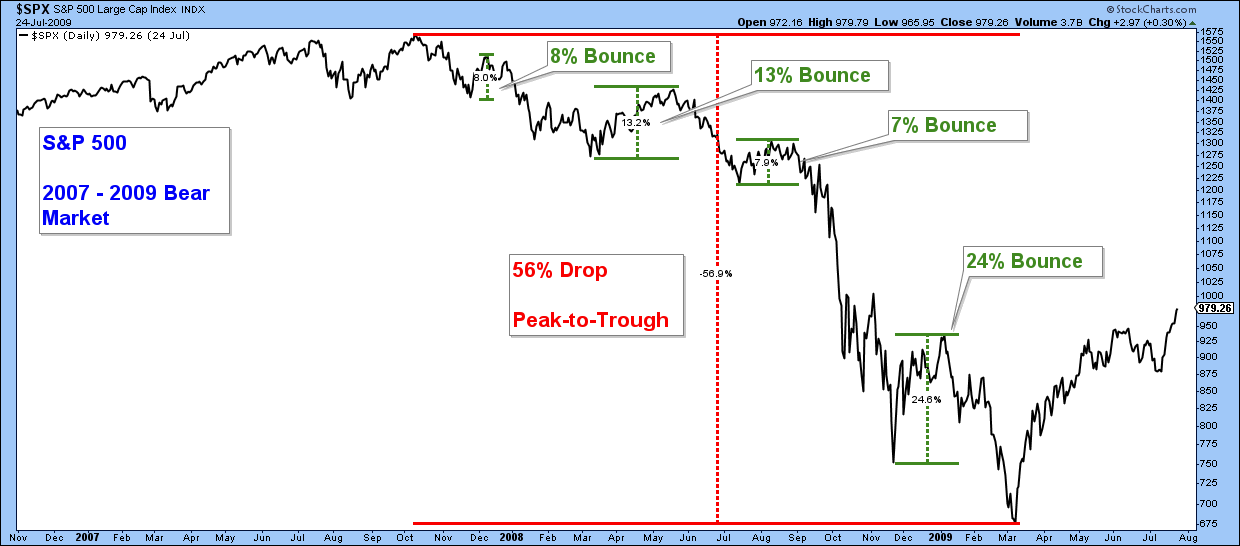
The last bear market occurred in 2007 – 2009. Below is a chart of the S&P 500 over that period. As you will notice, there were numerous bounces that totaled between 7% – 24% over the entire correction. Historically, bear markets wear you out and go out with a whimper, not a bang.
I plan on delving into this topic in detail in our upcoming webinar. Please feel free to register below. I would love to have you join us for what I hope is an informative, forward-looking analysis of financial markets.
Market Update Webinar
Wednesday – April 8, 2020, at 4:00 CST
Register Now Using the Button Below

If you have specific questions or topics you want us to address, please email them to: [email protected]
If you want to see what we were saying prior to the market correction, please review our two market updates: Stock Market Looking Frothy and The Long and the Short of It.
If anyone has questions or concerns, please feel free to contact me. Take care and be safe.

Craig Thompson, ChFC
Email: [email protected]
Phone: 619-709-0066
Asset Solutions Advisory Services, Inc. is a Fee-Only Registered Investment Advisor specializing in helping the needs of retirees, those nearing retirement, and other investors with similar investment goals.
We are an “active” money manager that looks to generate steady long-term returns, while protecting clients from large losses during major market corrections.
Asset Solutions may discuss and display, charts, graphs, formulas which are not intended to be used by themselves to determine which securities to buy or sell, or when to buy or sell them. Such charts and graphs offer limited information and should not be used on their own to make investment decisions. Most data and charts are provided by www.stockcharts.com.
Asset Solutions is a registered investment adviser. Information presented is for educational purposes only and does not intend to make an offer or solicitation for the sale or purchase of any specific securities, investments, or investment strategies. Investments involve risk and unless otherwise stated, are not guaranteed. Be sure to first consult with a qualified financial adviser and/or tax professional before implementing any strategy discussed herein. Past performance is not indicative of future performance.
All charts provided by: StockCharts.com