The Bottom Line
Bias:
Long-Term Positive and Short-Term Negative for Stocks.
Positive for Treasury Prices and Other Interest Rate Sensitive Bonds.
- The stock market is in a short-term corrective pullback. Odds favor more stock market weakness in the near-term.
- Long-term, the stock market looks strong. As long as the S&P 500 does not fall below about 2180, any weakness in stocks that we see in the coming weeks should be viewed as a buying opportunity once market internals turn positive.
- Treasury Yields topped out Mid-December and have been oscillating between support and resistance ever since. If yields fall below support, it would be positive for Treasury prices and other interest rate sensitive bond prices. Any further weakness that we may see in the stock market could be enough to push yields below support as investors move money out of stocks into the relative safety of US Treasuries.
Client Update
Client accounts are about 65% – 80% invested. Accounts are mainly allocated in Preferred Income Funds and Interest Rate Sensitive Bond Funds. We do not currently own any Equities. If Treasury Yields fall below support, I will probably increase our Interest Rate Sensitive Bond Fund allocation.
I am looking to increase market exposure once the stock market bottoms and market internals improve.
Market Technicals
Stock Market Price Action – Positive Long-Term & Negative Short-Term
The S&P 500 is above both it’s 50 and 200-day moving averages, and both those averages are trending higher. This is characteristic of positive long-term stock market price action.

Short-term, price action is negative. The S&P 500 has formed two lower-highs. Given that market internals are negative, odds are high that price will continue down to test support. The first level are the lows of last week. If that level gets violated, the next level is at about 2280 (3.3% below today’s close).

Stock Market Momentum – Negative
I monitor numerous momentum indicators, and most of them are negative and signaling that short-term momentum is to the downside.
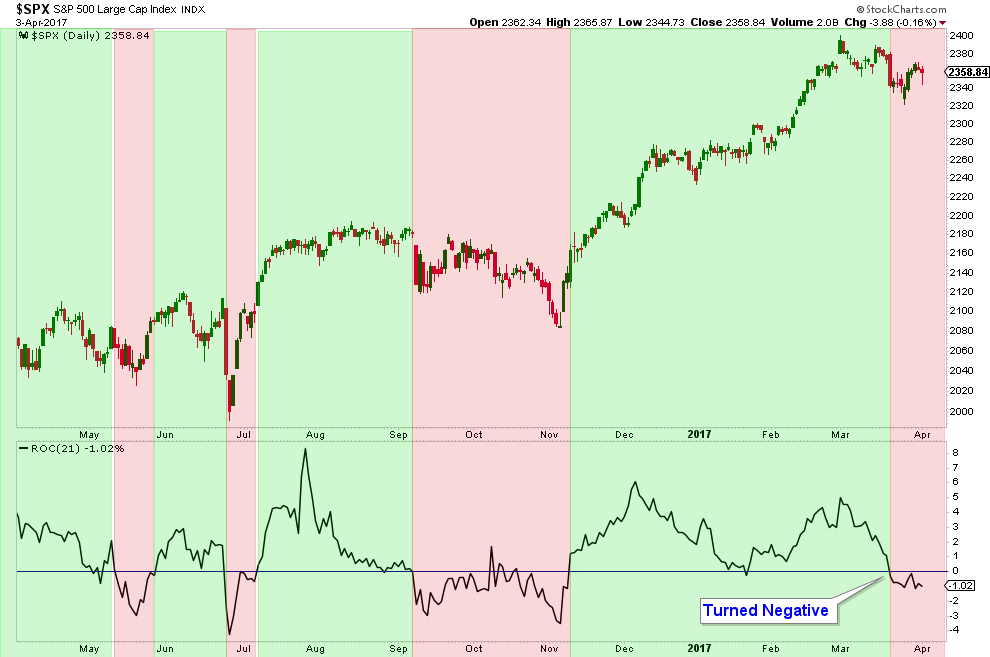
One of those indicators is the Rate-of-Change Indicator. When the indicator drops below zero it is a signal that short-term momentum has turned negative. Conversely, when it crosses up above zero, it is suggesting that short-term momentum has turned positive. Notice in the chart below, the Rate-of-Change Indicator turned negative recently.
Stock Market Breadth – Negative
Below is a chart of the NYSE Summation Index along with the S&P 500 in the panel below it. The Summation Index recently turned positive by crossing up above it’s moving average, which signals that market breadth is positive.

I am keeping my bias as negative for market breadth, even though the Summation Index turned positive. The bounce that we got in stocks last week was enough to turn the Summation Index higher, but it was weak as compared to previous short-term market bottoms.
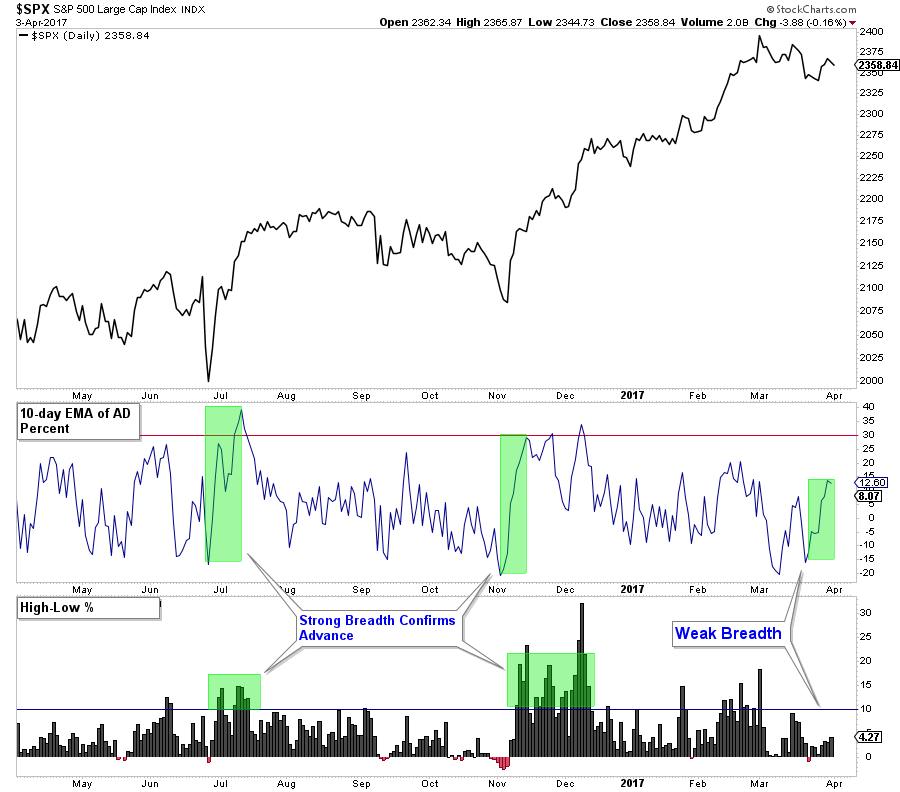
Below is a chart of the S&P 500 in the top panel, with a chart of the 10-day Exponential Moving Average of Advance-Decline Percent below it, and a chart of the High-Low Percent in the bottom panel.
Notice how on the two previous short-term bottoms, both breadth indicators advanced strongly. In both cases, the AD Percent advanced to between 30 – 40, and the High – Low Percent had numerous days where it exceeded 10.
Now look at last week’s bounce. Both breadth indicators didn’t get near those levels. Because this bounce was not confirmed with strong breadth, I feel that odds are high that we will see more short-term stock market weakness.
Market Sentiment – Negative
Not much has changed over the past week with regards to Market Sentiment. The VIX has been creeping up but is still at historically low levels. View last week’s newsletter for more details.
Treasury Bonds and Other Interest Rate Sensitive Bonds – Positive
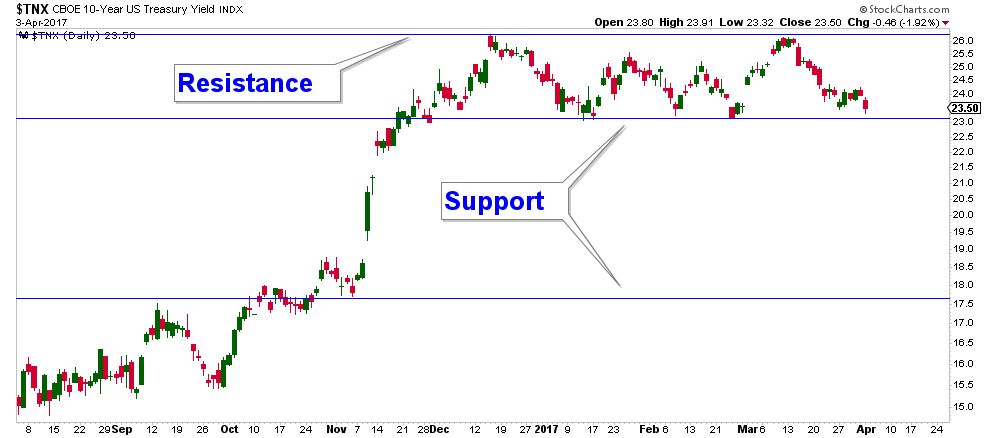
After advancing strongly, Treasury Yields have trended sideways since December 2016, fluctuating between support and resistance. In the chart below you can see that today’s close has the 10-Year Treasury Yield sitting right above support. It would not take much of a drop from here to break below this level.
Given that the next level of support is all the way down at about the 18 level, there is a good amount of upside for bond prices if yields break below support.
This is the New Retirement Hotspot. Hint: It’s Not Florida.

If you have any questions, please feel free to contact me.

Craig Thompson, ChFC
Email: [email protected]
Phone: 619-709-0066
About Asset Solutions
Asset Solutions Advisory Services, Inc. is a Fee-Only Registered Investment Advisor specializing in helping the needs of retirees, those nearing retirement, and other investors with similar investment goals.
We are an “active” money manager that looks to generate steady long-term returns, while protecting clients from large losses during major market corrections.
Asset Solutions is a registered investment adviser. Information presented is for educational purposes only and does not intend to make an offer or solicitation for the sale or purchase of any specific securities, investments, or investment strategies. Investments involve risk and unless otherwise stated, are not guaranteed. Be sure to first consult with a qualified financial adviser and/or tax professional before implementing any strategy discussed herein. Past performance is not indicative of future performance.