Stock Market Update
Bias:
Neutral for Stocks – The stock market is at a major inflection point
· I have been bullish since the early part of 2015 when stocks emerged out of a mini-bear market. However, over the past month, I have become decidedly less bullish because of a major deterioration in market technicals.
· I believe the stock market is at an inflection point. Any further weakness could tip the scale in favor of the bears and thus push the market into a major market correction.
· The long-term trend of the S&P 500 is still up. Until that changes, we are still in a bull market.
· The weight of the evidence is no longer decidedly bullish. What happens over the coming weeks will go a long way in determining the underlying strength of the stock market.
Client Update
In summary, there was enough negative technical data that developed over the past month that I turned very cautious about the risk that I am willing to take. Protecting client principal is one of the main reasons that my clients hire me. My strategy revolves around reducing the risk in our client accounts when the risk in the market is elevated.
Stock market risk has increased over the past month. As a result, I lowered our equity exposure substantially.
If market technicals improve, then I will look to increase equity exposure.
Market Technicals
We are now halfway through 2018 and how did things go? It was the best of times and it was the worst of times (well maybe not the worst, but not great). If we look at the markets leading sectors: Technology (XLK) returned +9.3% and Consumer Discretionary (XLY) +11.37%. Those are great returns for only 6 months. However, the returns for some of the other sectors that make up the S&P 500 did not fare near as well: Financials (XLF) returned -3.9%, and Industrials (XLI) -4.7%.
If we look at the major market indexes and bonds, the S&P 500 ended the midway point at +1.6% and the Dow Jones Industrial Average returned -1.8%. Bonds were down with Treasuries (TLT) returning -3%, US Aggregate Bond (AGG) -1.6%, and High Yield (HYG) -.28%.
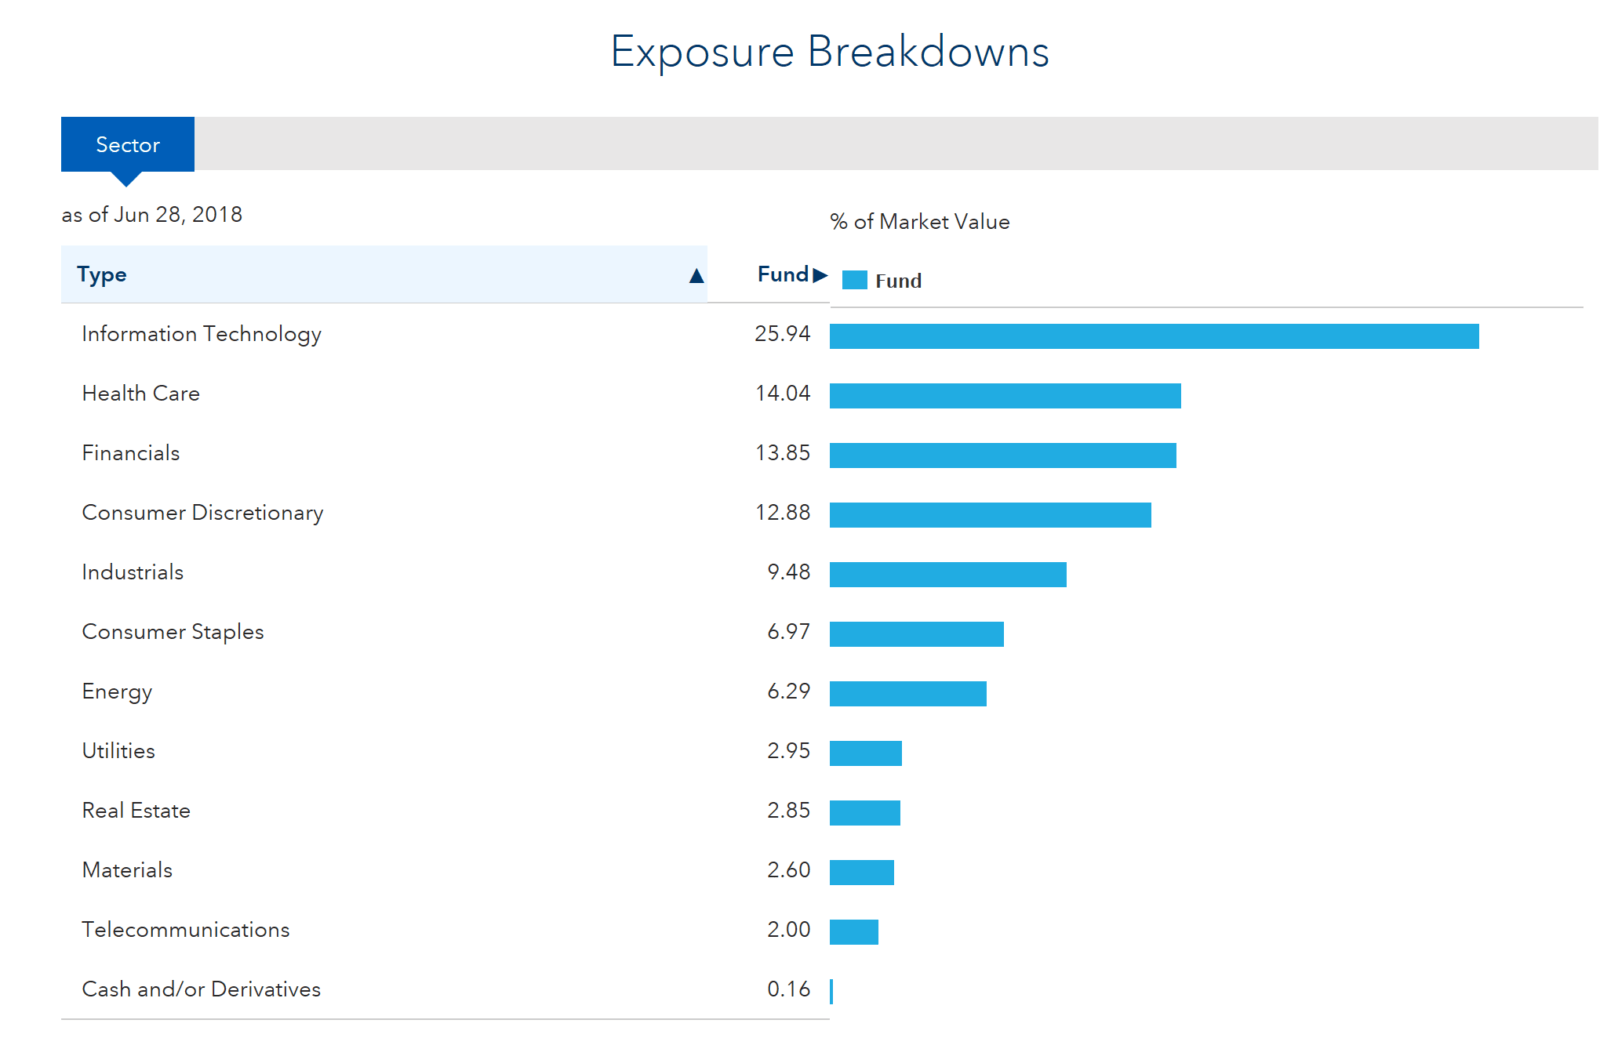
Sectors make up the S&P 500. How those sectors perform will determine how the S&P 500 performs which is a proxy for the stock market. Below is a chart of the sectors and their weighting of the S&P 500.
 In my newsletters going all the way back to the second quarter of 2016, I have not written much about the negatives technical aspects of the market because there really were not any of note. That has changed over the past month. Let’s start by looking at the positive technical aspects of the market and end with those negative technicals that have emerged over the past month.
Positive Market Technicals
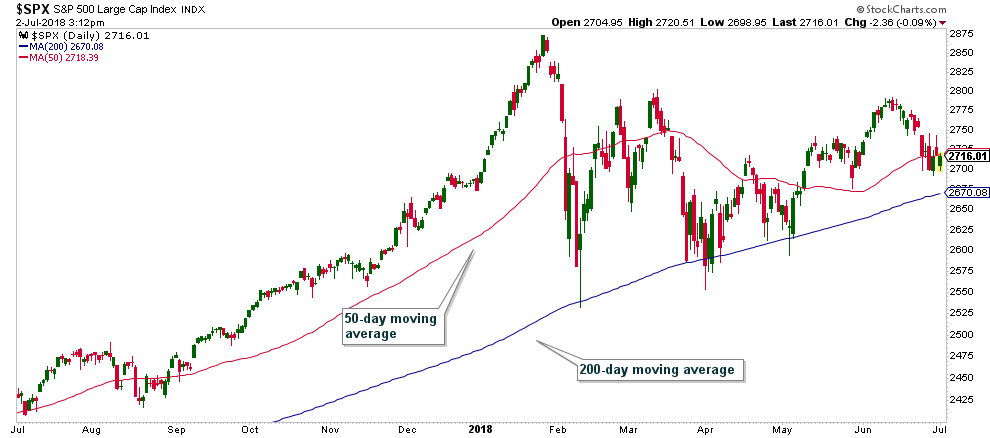
Price action on the S&P 500 is still in a long-term uptrend and its 50-day moving average is above its 200-day moving average. However, price is sitting right above its 200-day moving average, and a drop below that level would create negative technical damage. In addition, the 50-day moving average while still above the 200-day, is not that far above and any continued short-term weakness would cause it to drop below that average which would also have very negative technical implications. However, that has not happened yet, so let’s not jump the gun.
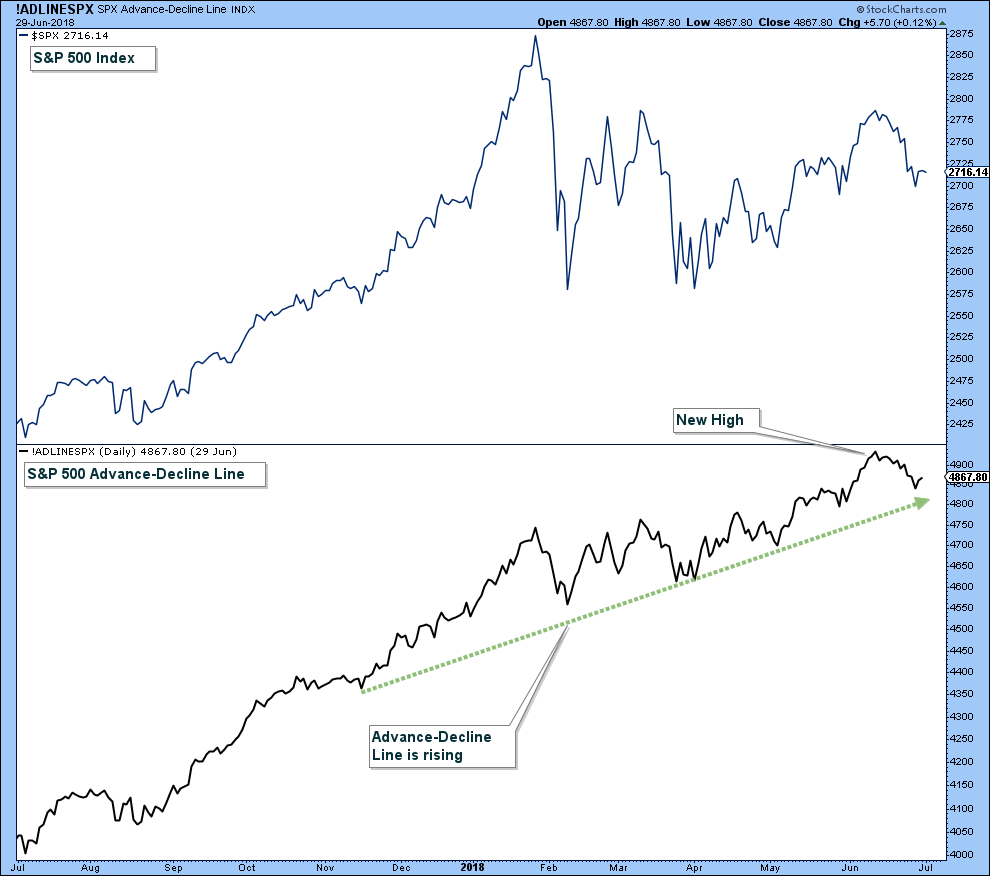
One of the main breadth indicators that I monitor is the advance-decline line. When that line is advancing strongly and hitting new highs, it is hard to get too bearish on stocks.
Negative Market Technicals
As I mentioned, the first half of the year has seen Technology and Consumer Discretionary advance strongly and Financials and Industrials performed poorly. All of these sectors make up the S&P 500 and are all highly correlated with that index. The key to the intermediate trend of the market may lie in whether Technology and Consumer Discretionary get dragged down by the underperforming sectors. Or if Financials and Industrials bottom soon because they are both near very important support.
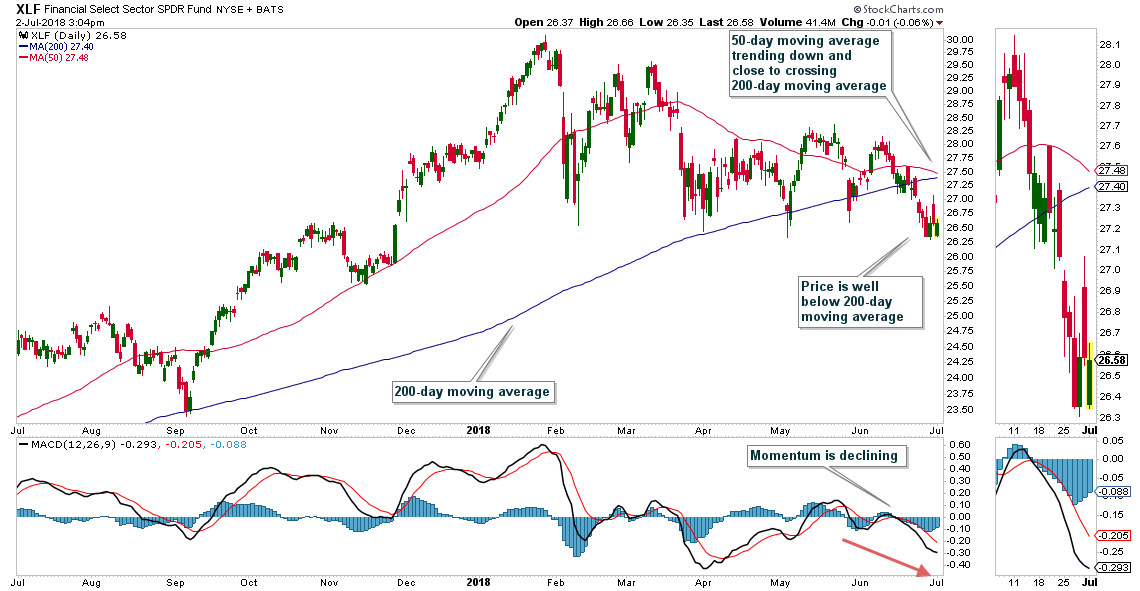
Below is a chart of a Financial Sector ETF (XLF). As you can see, price is below its 200-day moving average, the 50-day moving average is close to crossing the 200-day moving average, and momentum (in the bottom panel) is falling. Price is right at support that has been hit numerous times this year. This support needs to hold or it would have major negative technical ramifications for the broader market.
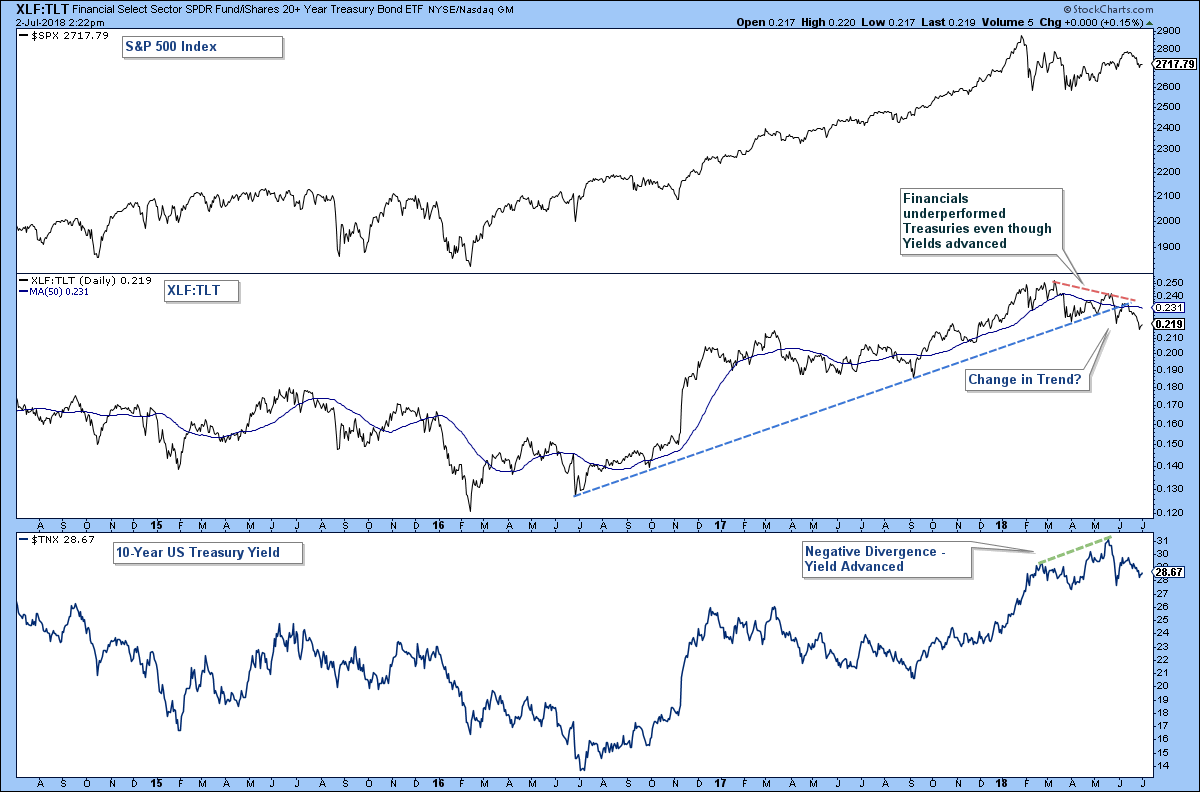
One chart that leads me to believe that the odds may favor Financials falling from here is that they have performed poorly recently relative to Treasury Bonds. Financials (XLF) is made up of a lot a bank stocks, and bank stocks are positively correlated with interest rates and bond yields, meaning increasing yields are a tailwind to Financial stocks. Those same increasing yields are a headwind for Treasury bonds. So rising yields are positive for financials and negative for Treasury bonds.
In the chart below is a three-panel chart. The top panel is the S&P 500, the middle is the relative performance of the Financial ETF (XLF) versus the Treasury ETF (TLT), and in the lower panel is a chart of the 10-Year US Treasury yield. Notice how in the lower panel the Treasury yield advanced (green dashed line) and in the middle pane over that same timeline, Financials under-performed Treasury bonds. Financials should be able to outperform Treasury bonds when yields rise and we are in a bull market for stocks. If they can’t it is a red flag.
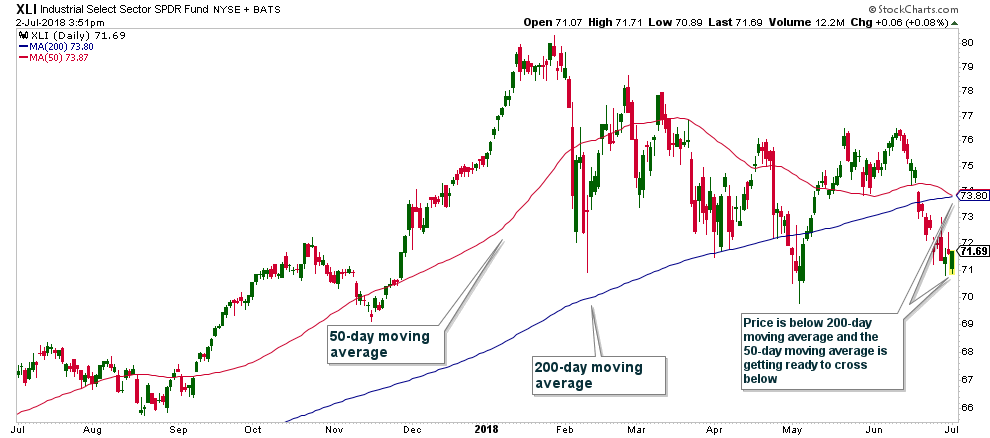
The Industrial Sector ETF (XLI) looks very much like the Financials ETF. Price is below its 200-day moving average and the 50-day moving average is getting ready to cross below the 200-day moving average. This is a bearish chart pattern. Price is at support from the May lows so XLI should at least get a short-term bounce here. The bottom line is that both XLI and XLF need to hold above these levels or it could have major negative ramifications for the broader stock market.
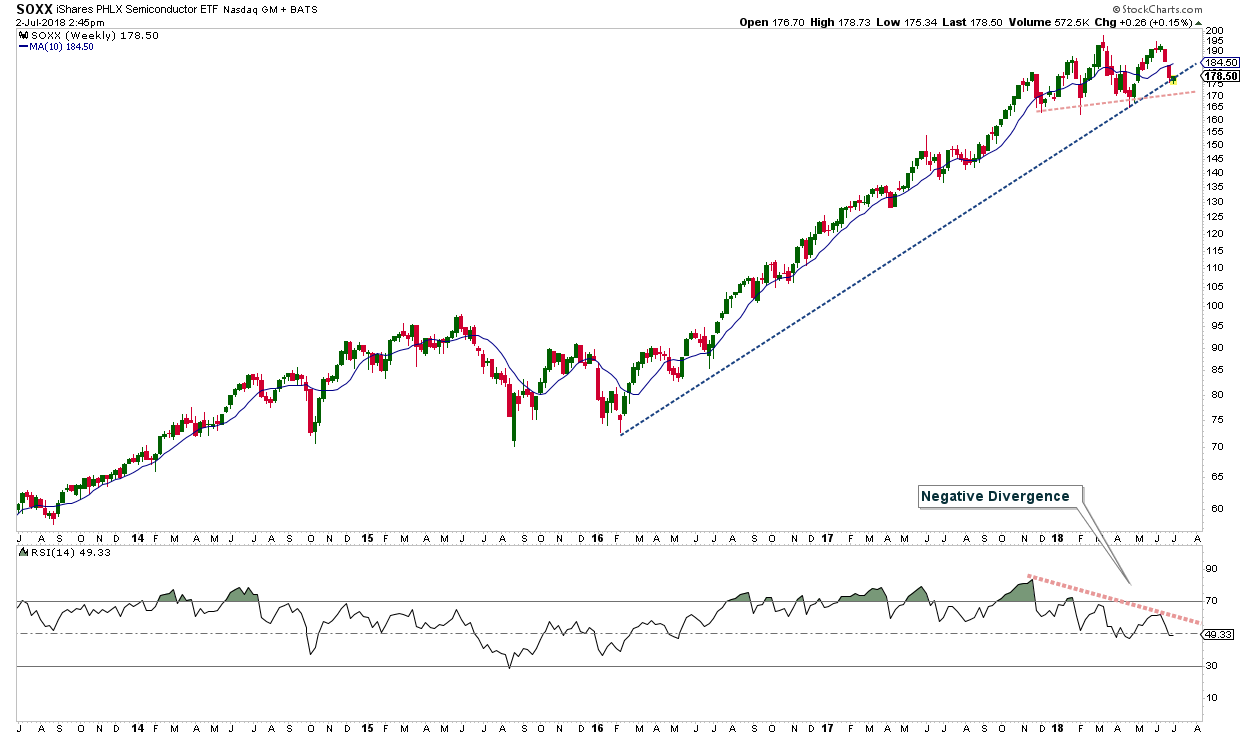
The Semiconductor Industry is a leading indicator for the Technology sector and it is the Technology sector that has been holding up the S&P 500. Below is a weekly chart of a Semiconductor ETF (SOXX). It is sitting right on a long-term trendline and has another shorter-term trendline just below that. This index needs to bounce from here or risk further downside momentum. In addition, if it violates the second trendline it would form a head-and-shoulder topping pattern which would be very negative for the broader market. In the lower panel is a momentum indicator and the fact that it has been negatively diverging with price has me worried that odds are elevated that Semiconductors are topping out. Keep in mind that none of this has happened yet, so let’s not jump the gun and count this as a negative. It is just something to watch.
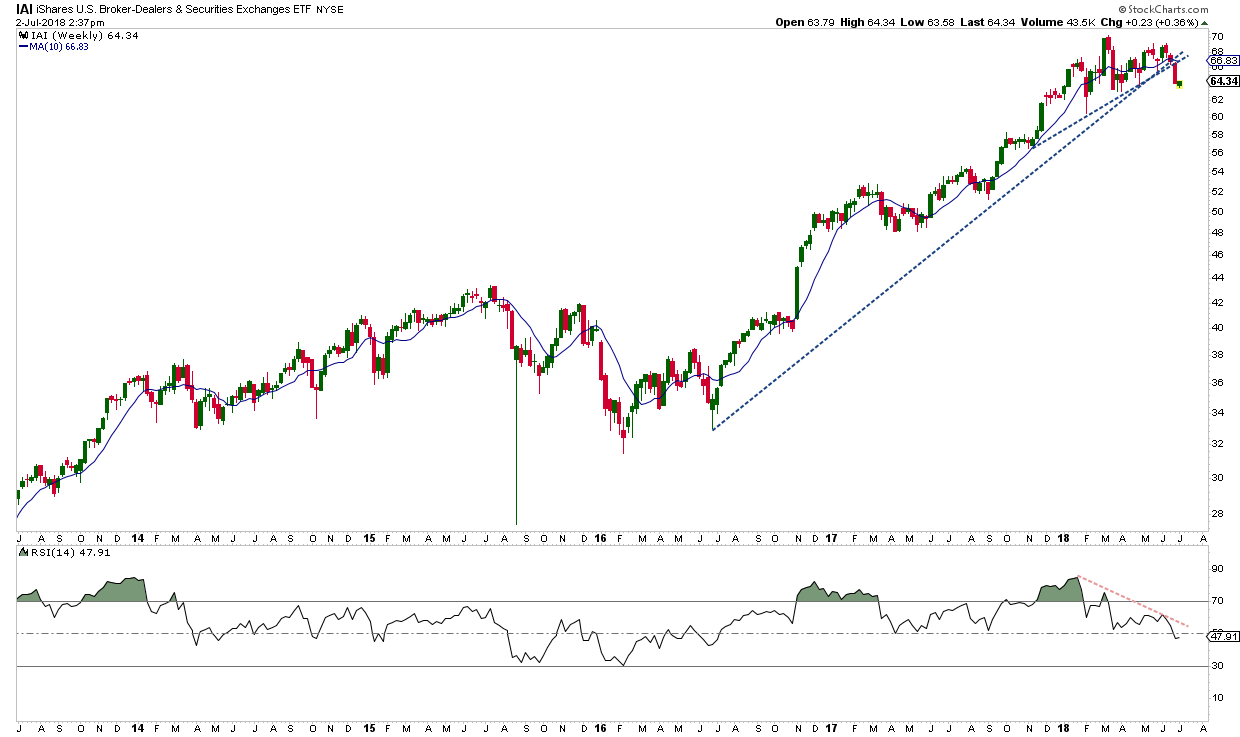
 Another market leader is the Broker-Dealers. Below is a weekly chart of the Broker-Dealer ETF (IAI). As you will notice, it has violated a couple of major trendlines and momentum in the lower panel is diverging negatively with price.
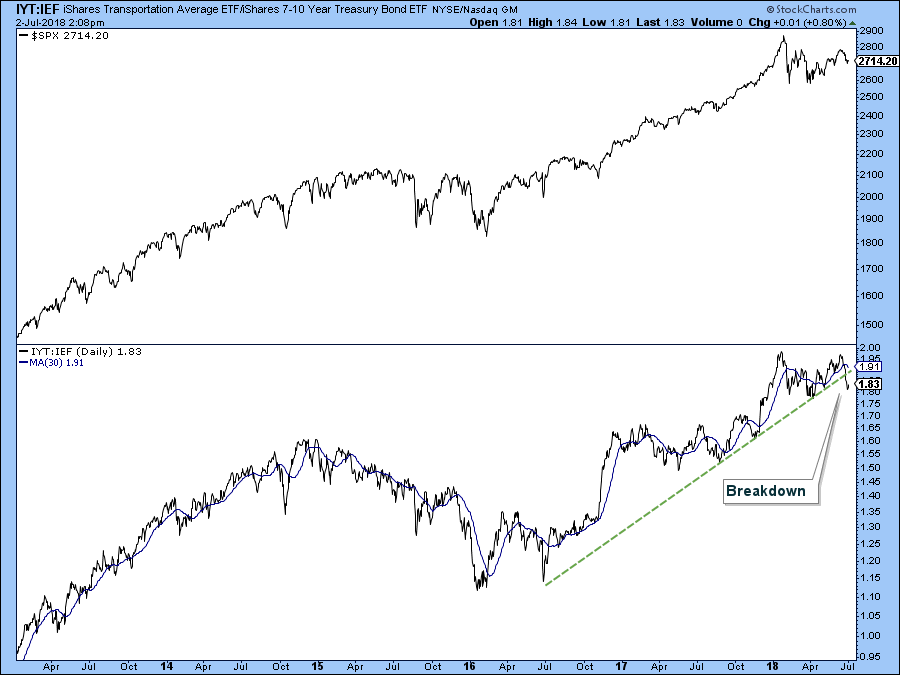
 If the economy and stock market are strong, then economically sensitive Transportation stocks should outperform Treasury Bonds. Below is a chart of the relative strength of the Transportation ETF (IYT) versus the 7-10 Year Treasury Bond ETF (IEF), in the bottom panel. The top panel is a price chart for the S&P 500. If the relative strength line is rising, then the Transportation fund is outperforming the Treasury bond fund, and that is bullish for the stock market. That relative strength line has just broken below a 2-year trendline. The fact that Treasury bonds are starting to outperform Transportation stocks is a red flag.
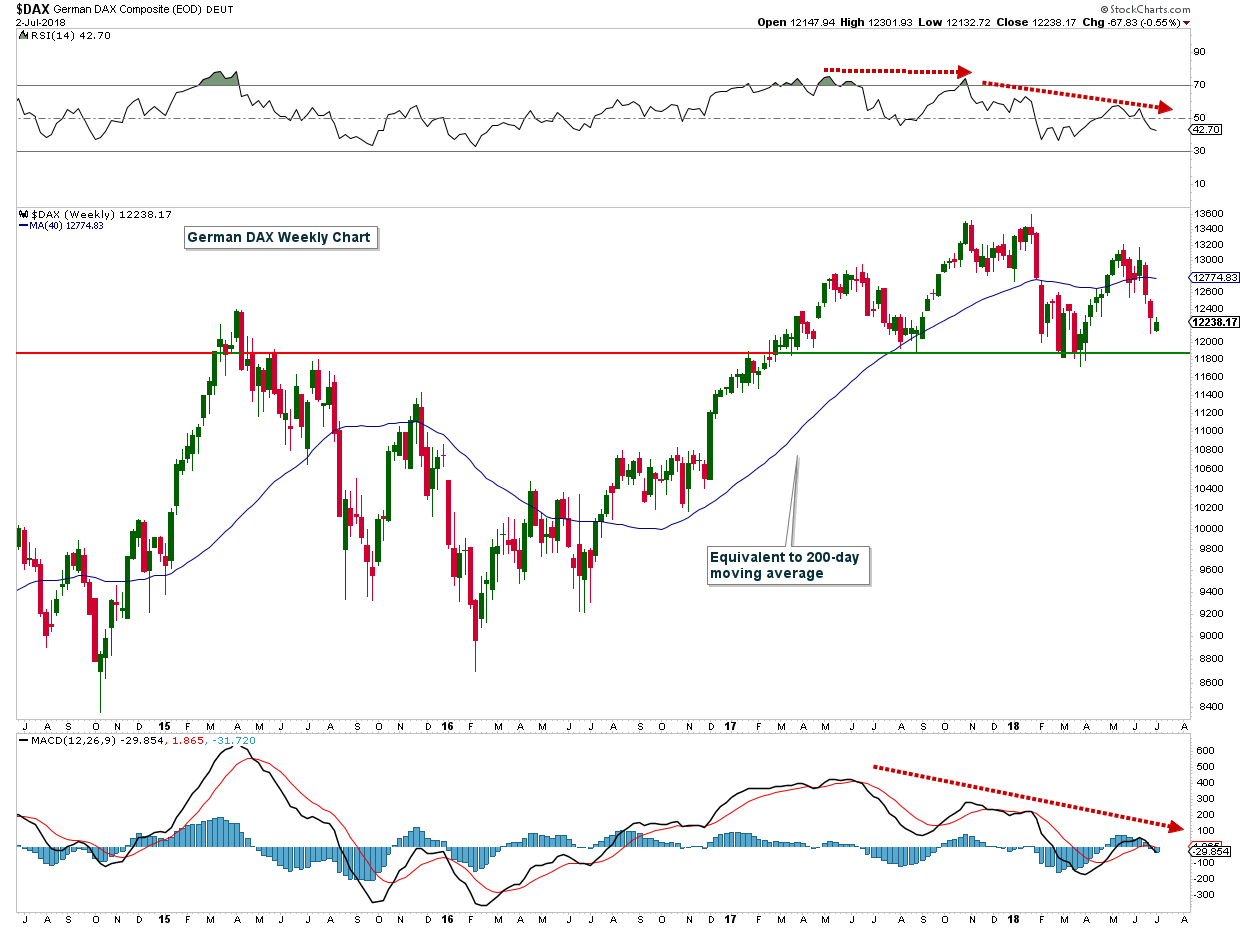
International indexes are as a whole doing much worse than our market. The fact that international markets are falling is bearish for our stock market since our market is positively correlated with many international markets. One of those markets is the German DAX Index in the chart below. This is a weekly chart and the moving average is equivalent to a 200-day daily moving average. As you will notice, this index is well below its 200-day moving average and momentum indicators have been signaling a negative divergence. The MACD in the lower panel just turned down from a low level and this is suggesting strong negative momentum.
Market breadth has been deteriorating over the past few weeks and that is showing up in many of the breadth charts that I monitor, such as the Summation Index below. This index is now falling and this is not what you want to see when the broad stock market indexes and sectors are at an inflection point.

If you have any questions or would like me to review your portfolio, please feel free to contact me.

Craig Thompson, ChFC
Email: [email protected]
Phone: 619-709-0066
Asset Solutions Advisory Services, Inc. is a Fee-Only Registered Investment Advisor specializing in helping the needs of retirees, those nearing retirement, and other investors with similar investment goals.
We are an “active” money manager that looks to generate steady long-term returns, while protecting clients from large losses during major market corrections.
Asset Solutions is a registered investment adviser. Information presented is for educational purposes only and does not intend to make an offer or solicitation for the sale or purchase of any specific securities, investments, or investment strategies. Investments involve risk and unless otherwise stated, are not guaranteed. Be sure to first consult with a qualified financial adviser and/or tax professional before implementing any strategy discussed herein. Past performance is not indicative of future performance.