The stock market experienced an 11% decline last February, but we stayed with our bullish thesis. Last month the stock market experiences another 11% decline, and now we are bearish stocks. So, what’s the difference this time?
Overall, there is a host of negative factors that I am seeing in this decline that were not present in the February 2018 decline. Namely, we have seen market breadth turn negative, the S&P 500 is trading below its 200-day moving average, international markets are falling hard, and risk-off assets are decisively outperforming risk-on assets. Given all these factors, the weight of the evidence has turned bearish.
Does all this guarantee that the stock market is going to continue to fall? Of course not. We are entering a seasonally strong period for stocks, and it is obviously possible that stocks could rocket higher, proving this downturn (in hindsight) was nothing but a correction within a longer-term uptrend. Do I think that the odds favor this outcome? Definitely not!
The majority of the technical evidence has turned decisively bearish. At some point that will change, and when it does I will reevaluate my bearish thesis.
Published: 11/5/2018
Stock Market Summary
Bias:
Negative for Stocks (The Weight of the Technical Evidence is Bearish for Stocks)
Neutral for Interest Rate Sensitive Bonds (Early Bullish Signals Are Beginning to Emerge)
Bearish Factors
- The S&P 500 is in a downtrend, and the index has fallen below its 200-day moving average.
- Risk-on assets are underperforming risk-off assets and this is bearish for the broader stock market.
- International markets are leading our market lower.
- Market breadth is negative.
- Bond yields are flashing signs of a possible near-term top, which would be positive for bond prices.
Bullish Factors
- The S&P 500 50-day moving average has not crossed below it’s 200-day moving average (yet).
- The yield curve has not inverted.
- November through May is historically strong months for the stock market.
Client Update
I currently view stock market risk to be high and thus I have client accounts invested 100% in money market funds.
Summary of How I Manage Client Accounts:
- I do not use a buy-and-hold approach like most financial advisors. I believe this strategy, while good for young investors, can have severe adverse consequences for those in or near retirement.
- I use technical analysis to manage risk and preserve principal during major stock/bond market corrections (Bear Markets).
- I have two basic models that I use to manage client accounts. One is conservative and appropriate for investors that are in or near retirement, and an aggressive model for younger more aggressive investors.
- I am a risk manager and will increase our risk level when risk in the market is low, and decrease our risk when risk in the market is high.
Market Technicals
Below is a monthly chart of the S&P 500 going all the way back to the beginning of the bull market that began at the beginning of 2009. The long-term trendline that has defined the bull market has now been violated. When long-term trends are reversed it usually signals new long-term trends in the reverse direction. Adding further bearish implications is that the index has now fallen below its 12-month moving average, and momentum has turned down.

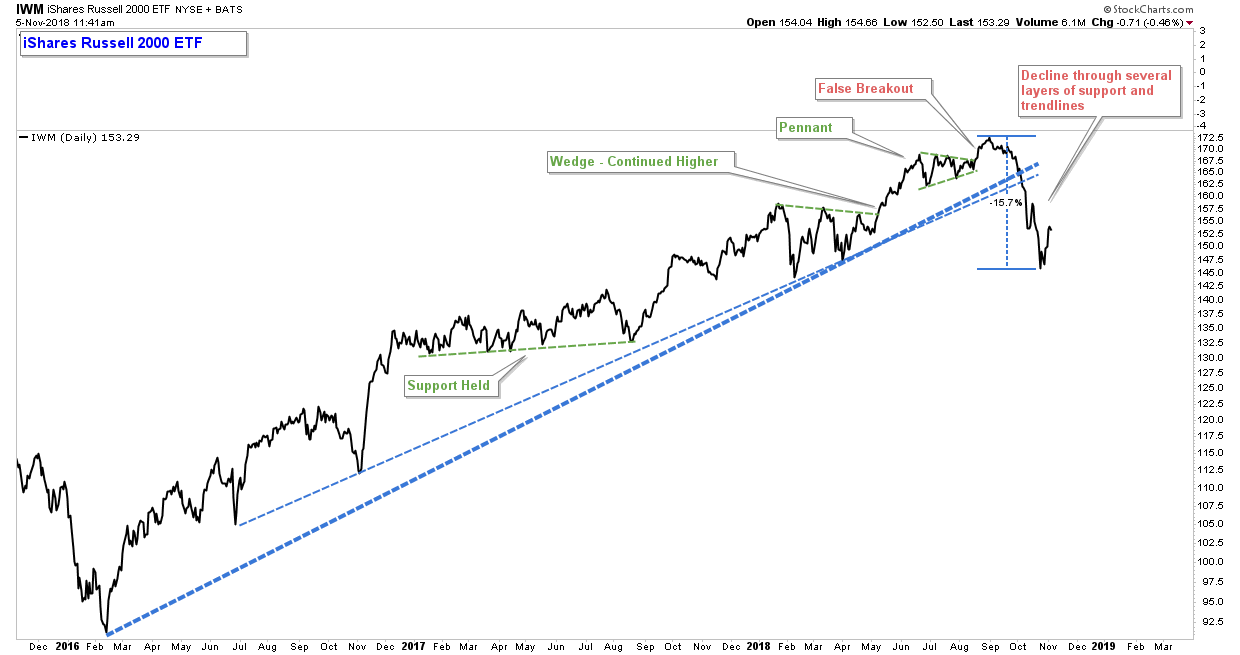
Small cap stocks are often a market leader because they are considered to be more aggressive than larger, more established stocks. Small caps peaked a month before the S&P 500 and have fallen over 15% peak-to-trough.
During strong bull markets, stocks and stock indexes have a strong tendency to stay above trendlines, bounce off support, and resolve to the upside out of periods of consolidation. As you can see in the chart below of IWM (Small Cap Index ETF), this held true up until last month.
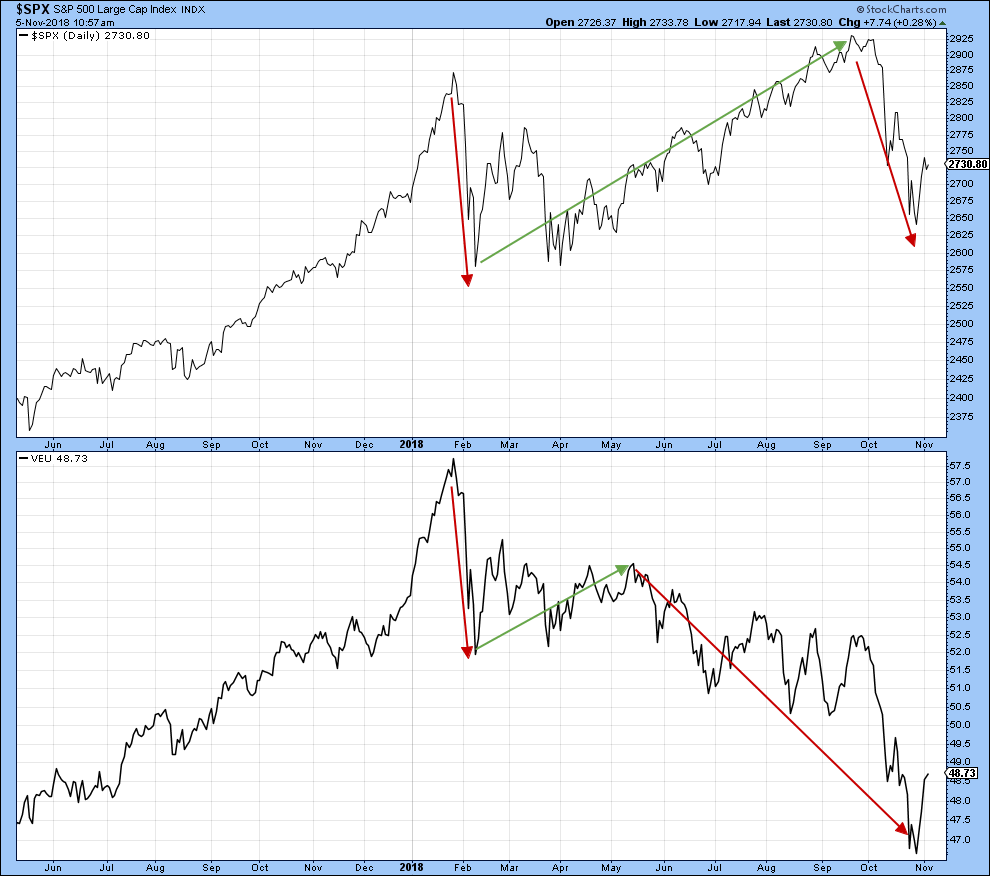
Our market peaked in September, however, the world peaked in January as noted in the chart below. The S&P 500 is in the top panel and the Vanguard World Ex the US is in the lower panel.
The US stock market “was” hitting new highs in August/September while world markets were falling. Can our market advance strongly while most every other country is declining? Yes, but it is unlikely especially this late in the economic cycle.
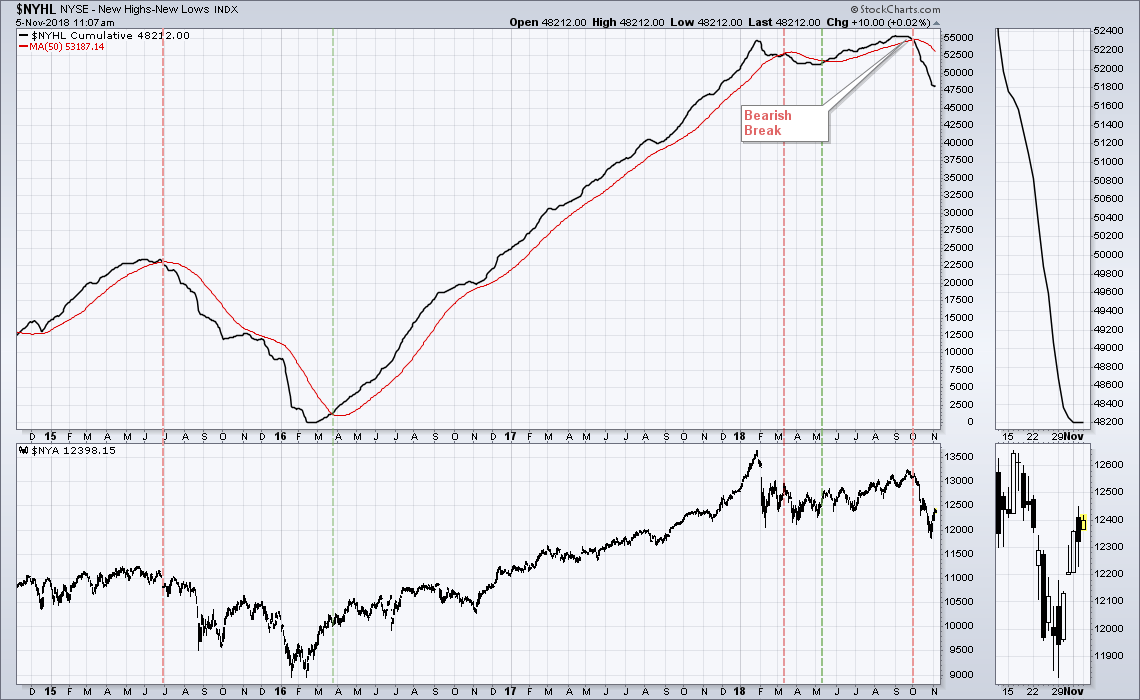
Market breadth has turned decisively negative. There are numerous charts that I could use here, but the New Highs – New Lows is a good long-term breadth indicator that has done a good job of forewarning of past major market declines.
Institutional managers move markets and when they are bearish they move money out of high-risk assets and into lower-risk assets. It takes them weeks/months to sell positions because of the size of their portfolios. When risk-off assets are outperforming risk-on assets, it is a huge red flag!
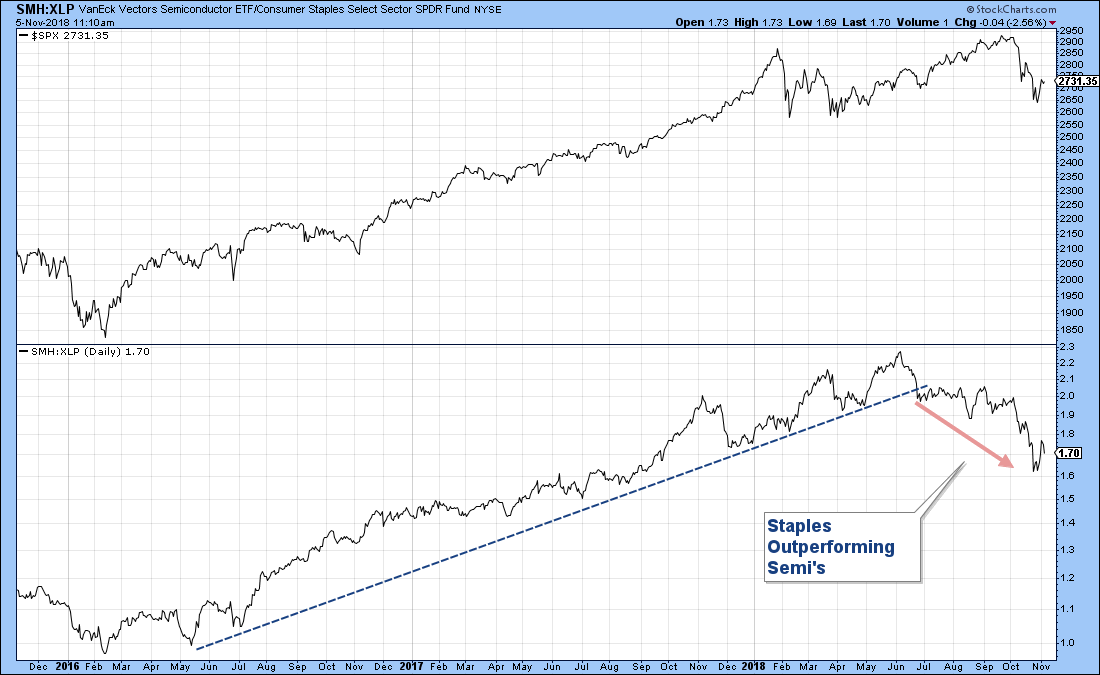
In the lower panel below is a chart of the relative performance of a Semiconductor ETF (a risk-on industry group) versus a Consumer Staples ETF (a risk-off sector). In the upper panel is the S&P 500 index.
When the relative strength line is advancing, Semi’s are outperforming Staples and vice versa. As you can see, Semi’s have been outperforming since the beginning of 2016 and had stayed above the bullish trendline that I have drawn. That all ended in June when the relative strength line fell below that trendline and has continued to fall.
There are numerous other charts that I could show that would illustrate the same thing we are seeing in the chart below. Risk-on assets are getting pummeled relative to risk-off assets and this is very bearish for the broader stock market!!
I have been bearish bonds for over a year now, and bonds have been falling over that time period. However, there are some things that I am seeing in the bond market that could be warning us that bond yields are primed to fall and thus interest rate sensitive bonds could advance. If that occurs, it would fit our theme of being at the beginning of a bear market. During bear markets money typically moves out of stocks into bonds, which drives down yields and moves prices higher. This has not happened yet, but it is something to watch. If stocks continue to fall, bonds may be the place where we can reallocate money to attempt to capture gains.
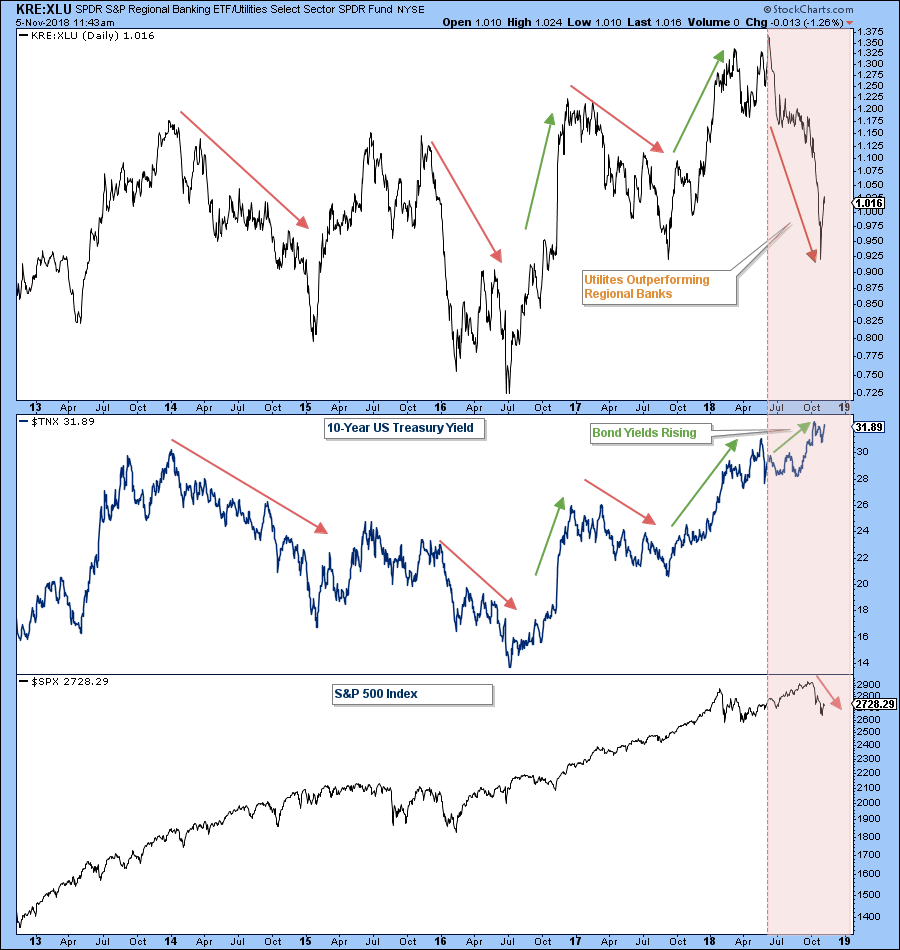
In the chart below is another relative strength chart, with the relative strength of a Regional Bank ETF versus a Utilities ETF in the upper panel and the 10-Year Treasury Yield in the middle panel. When the market believes that rates are going higher, you see money flow into Regional Bank stocks at a faster pace than it flows into higher yielding stocks like Utilities. And when markets believe rates are going lower, money tends to favor utilities over banks.
Normally the relative strength line moves in tandem with bond yields, as you can see with the arrows in the chart. However, something is now off. Look at the red shaded area. Bond yields have been moving higher, however, we are getting a major downturn in the ratio. What’s up with that? Banks have been getting hammered and utilities have been doing relatively well. This could be a signal that bond yields are poised to fall and bond prices could rip higher. If that happens it would follow our bearish thesis on the stock market, because of the flight to safety that you historically see during major stock market corrections.
If you have any questions or would like me to review your portfolio, please feel free to contact me.

Craig Thompson, ChFC
Email: [email protected]
Phone: 619-709-0066
Asset Solutions Advisory Services, Inc. is a Fee-Only Registered Investment Advisor specializing in helping the needs of retirees, those nearing retirement, and other investors with similar investment goals.
We are an “active” money manager that looks to generate steady long-term returns, while protecting clients from large losses during major market corrections.
Asset Solutions is a registered investment adviser. Information presented is for educational purposes only and does not intend to make an offer or solicitation for the sale or purchase of any specific securities, investments, or investment strategies. Investments involve risk and unless otherwise stated, are not guaranteed. Be sure to first consult with a qualified financial adviser and/or tax professional before implementing any strategy discussed herein. Past performance is not indicative of future performance.